
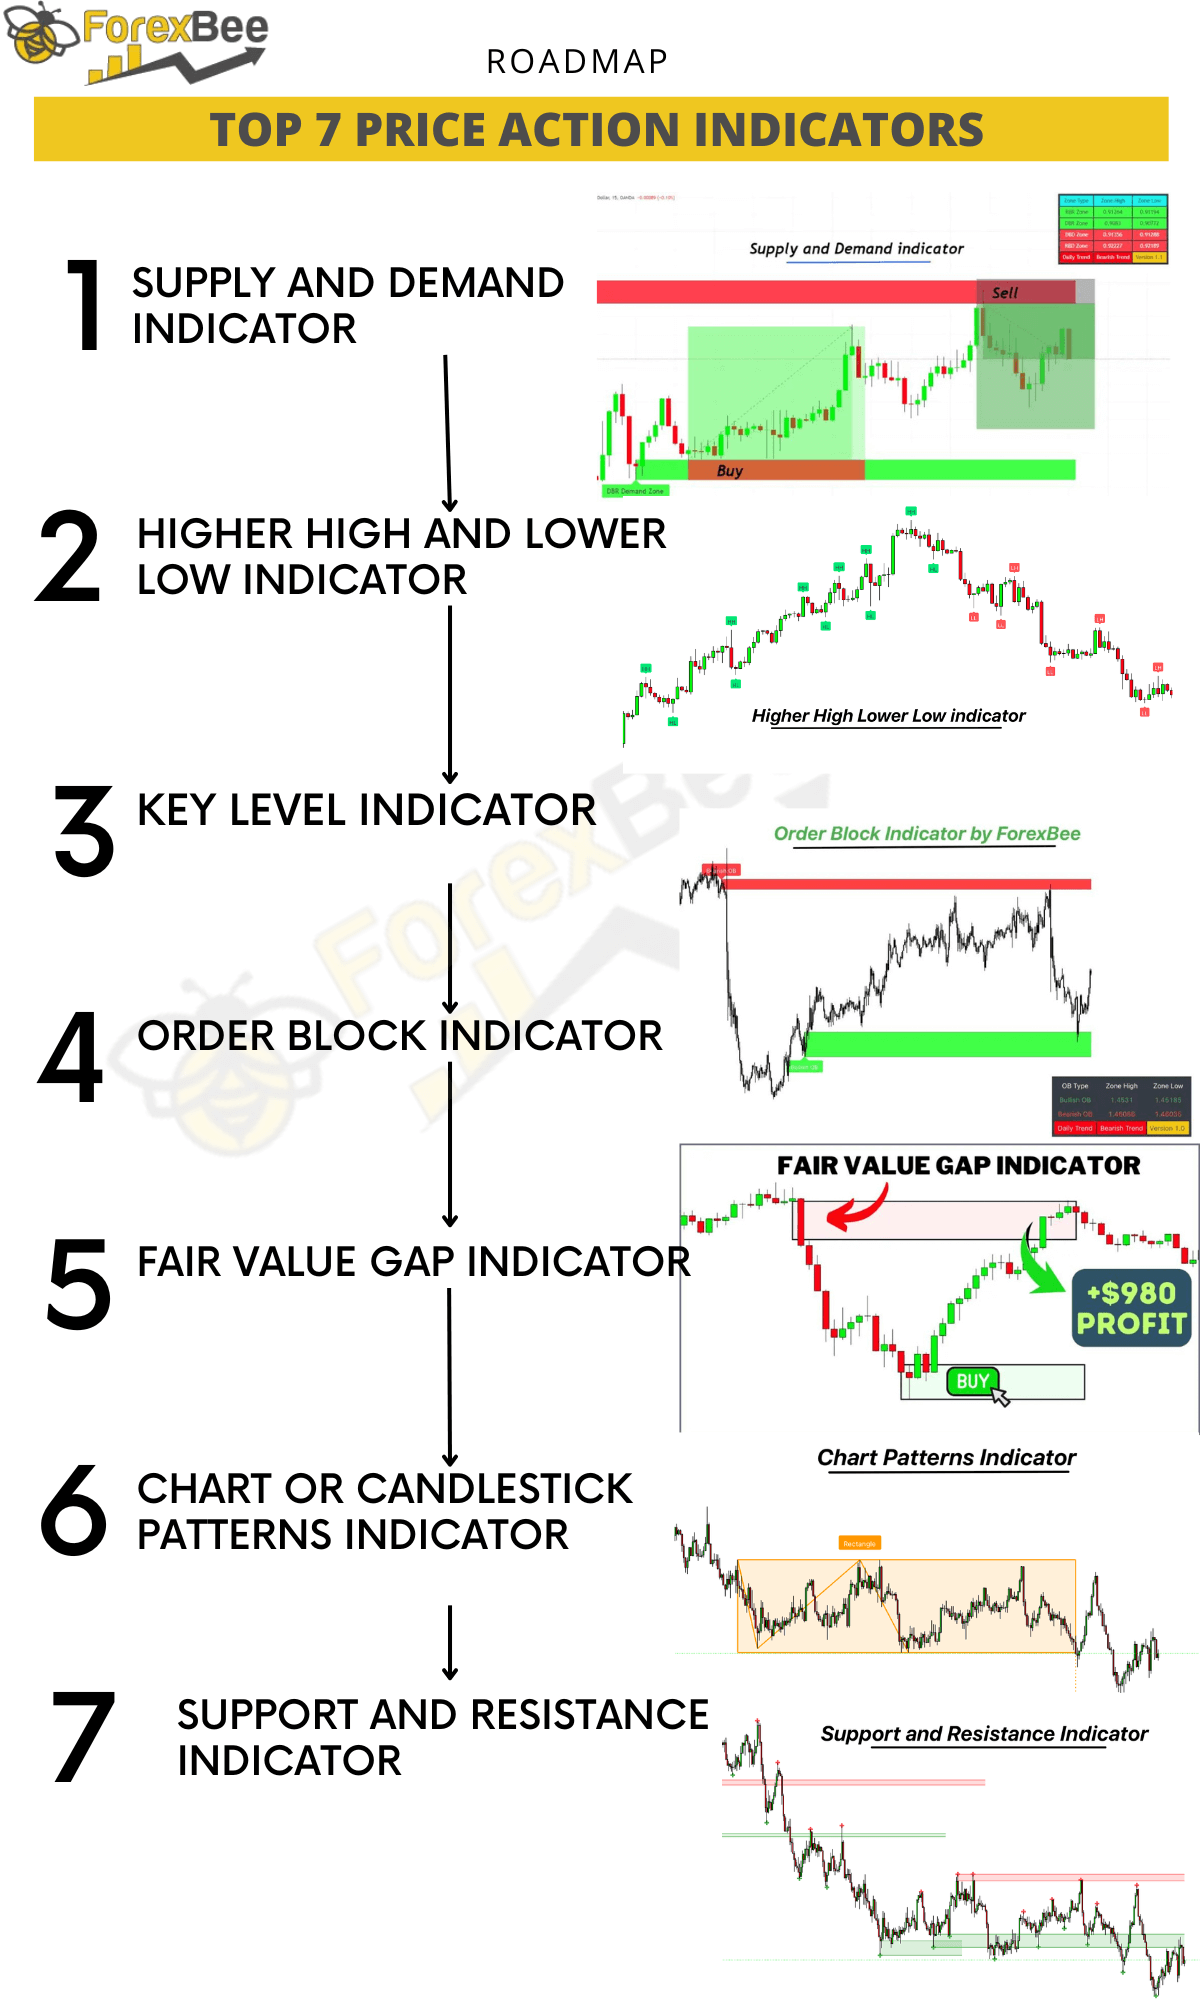
The price action indicator is a tool that identifies repetitive price patterns on a chart, aiming to forecast future price movements based on past patterns.
In this article, I’ll highlight the top 7 price action indicators for traders. While I often emphasize the importance of pure price action over-reliance on indicators, the advancements in trading technology have given rise to indicators based on price action. These can provide traders with valuable insights, and it’s beneficial to integrate them into your strategy.
List of Price Action Based Indicators
Price action is like watching what the market does over and over again. Let’s say you see a certain shape, like a triangle, form on the chart a few times. And every time that triangle shows up, the price seems to follow a specific direction afterwards.
That’s a hint.
This triangle is giving us a clue about where the price might go next. So, in simple terms, price action is just keeping an eye on these repeat patterns to guess the market’s next move. It’s like spotting patterns in a game and using them to your advantage.
I’ve picked seven top price action indicators that can help traders score more wins. Your trading style will decide which ones you lean on. I’ll break down what each does, so you can slot them right into your strategy.
- Supply and demand indicator
- High high and lower low indicator
- Key Level indicator
- Order block indicator
- Fair value gap indicator
- Chart or candlestick patterns indicator
- Support and Resistance indicator
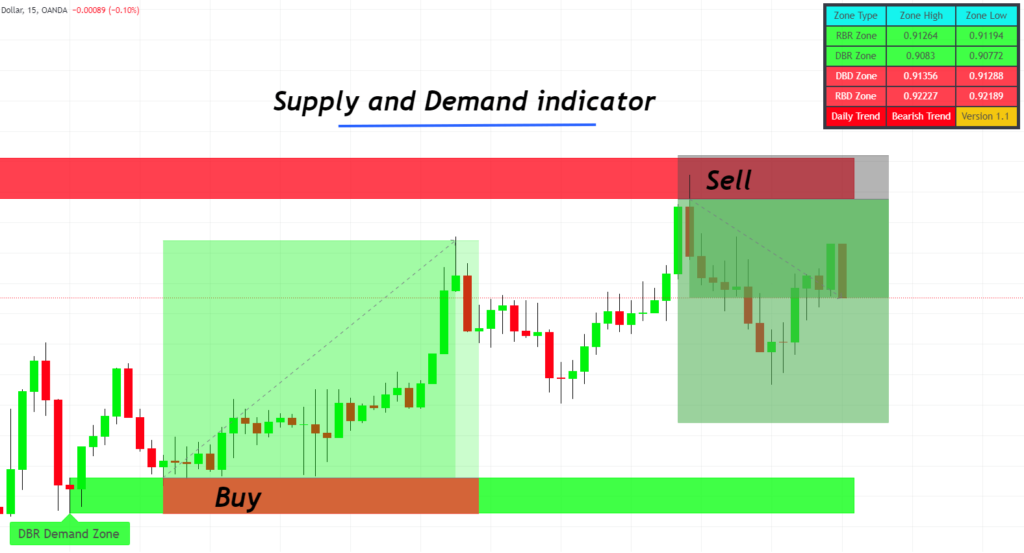
1. Supply and Demand indicator
The supply and demand indicator helps traders find the best spots to enter a trade, aiming for high rewards with less risk. It’s really popular among traders because understanding supply and demand is at the heart of trading.
This indicator works with four main patterns:
You’ll often see these patterns on your charts. By spotting them, you can set up your buy or sell trades in line with your trading plan.
I suggest every trader to give this indicator a try. It can point you to the right entry, keep your risk low, and potentially increase your profits.
Here’s the table for the Supply and Demand Indicator:
| Feature | Description |
|---|---|
| Indicator Name | Supply and Demand Indicator |
| Primary Use | Finding optimal trade entries |
| Function | Highlights areas of significant supply and demand |
| Key Patterns Used | Rally Base Rally Drop Base Drop Rally Base Drop Drop Base Rally |
| Recognition | Commonly seen patterns on charts |
| Trade Placement | Helps set up buy/sell trades aligned with strategy |
| Recommendation | Suitable for all traders to enhance entry points |
| Risk & Reward Benefit | Lowers risk and potentially increases profit |
| Accessibility | Paid on TradingView |
2. Higher High and Lower Low indicator
In both trading and life, going with the flow often makes things smoother. In trading, this ‘flow’ is the market trend. Riding the trend can boost your chances of profitable trades. Yet, for many traders, especially new ones, spotting this trend amidst the ‘noise’ of the market can be tricky. That’s where the ‘Higher High and Lower Low’ indicator comes in handy.
So, what’s this indicator all about? Simply put, it pinpoints the peaks (swing highs) and troughs (swing lows) in price action to help you see the trend direction. If you notice a pattern of increasing peaks and troughs, that’s a bullish trend. On the other hand, decreasing peaks and troughs signal a bearish trend. Ideally, you’d want to see a sequence of at least three highs or two lows to confirm a trend.
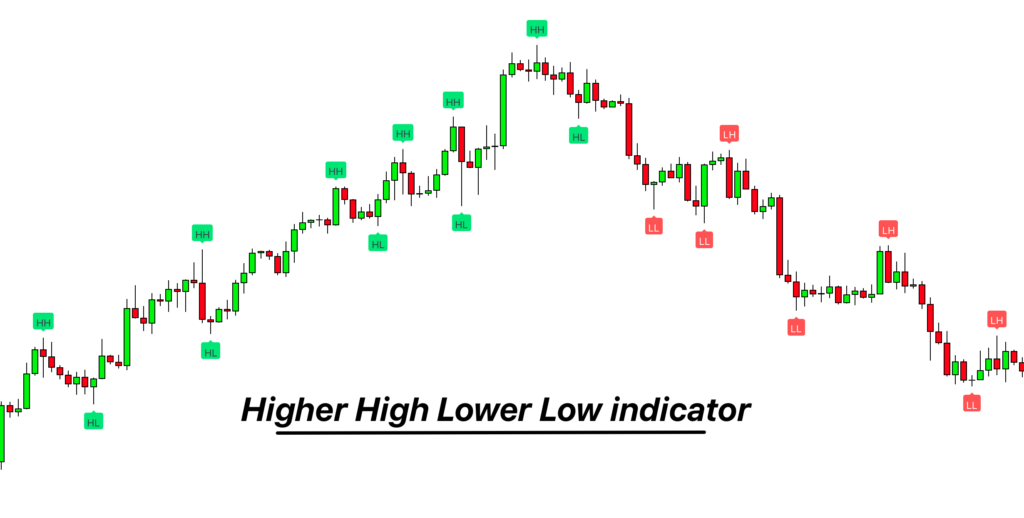
This tool works well on any timeframe, making it a great addition to any trader’s toolkit, especially if you’re just starting out. Plus, it’s versatile enough to analyze any currency pair or financial asset you’re interested in.
| Feature | Description |
|---|---|
| Indicator Name | Higher High and Lower Low Indicator |
| Primary Use | Identifying market trends |
| Function | Pinpoints swing highs and lows in price action |
| Trend Identification | Bullish: Increasing peaks and troughs<br>Bearish: Decreasing peaks and troughs |
| Confirmation Criteria | At least three highs or two lows for trend confirmation |
| Suitable For | All timeframes |
| Ideal Users | Beginner and intermediate traders |
| Versatility | Can analyze any currency pair or financial asset |
| Accessibility | Free on TradingView |
3. Key level indicator
The Key Level Indicator shows important spots on a chart. Think of it like this: places where lots of buying or selling happened before. We find these by looking where the price changed direction many times. If the price often stops and turns around at a certain spot, that’s a key level.
When you add the Key Level Indicator to your chart, it shows potential reversal zones.
If a bullish candle forms at this key level, it signals a possible upward move. Conversely, a bearish candle at a key level suggests a potential drop in price.
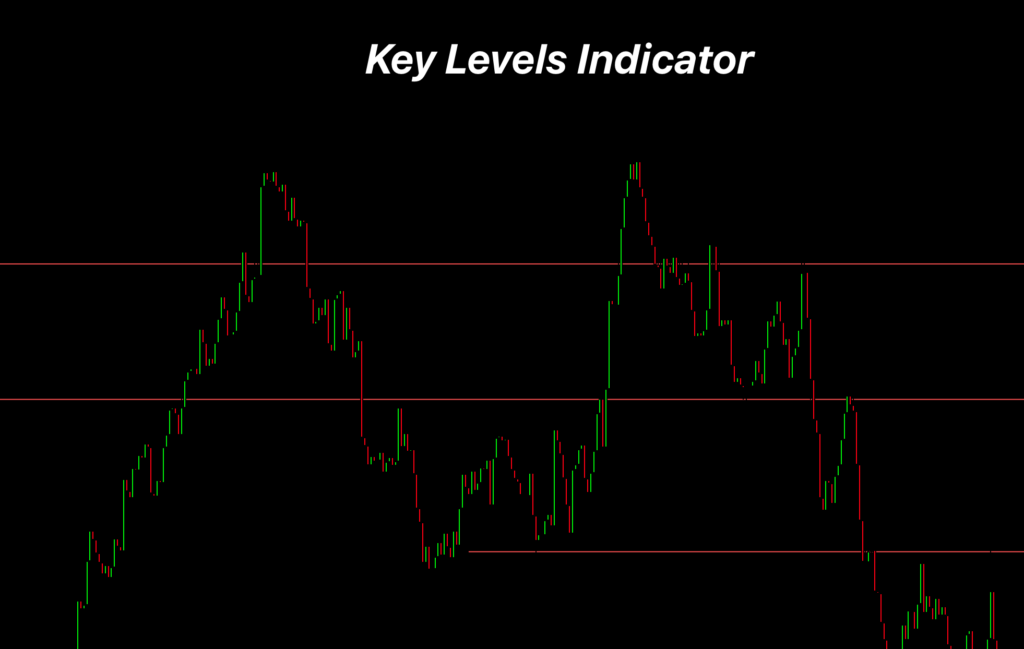
For best results, start by observing these levels on a daily chart and then refine your entry points on shorter timeframes. This indicator is valuable for traders aiming to capitalize on trend reversals.
| Feature | Description |
|---|---|
| Type | Price Action Based |
| Function | Identifies market turning points |
| Principle | Marks areas with significant buyer/seller interest |
| Identification Methods | Historical levels, high and low of reversal candlesticks |
| Trend Reversal | Bullish candlestick at key level suggests bullish trend reversal; Bearish candlestick suggests bearish reversal |
| Best Timeframe | Daily (for identification), then trade on lower timeframes |
| Suitable For | All traders; especially those using reversal strategies |
| Availability | Free on TradingView |
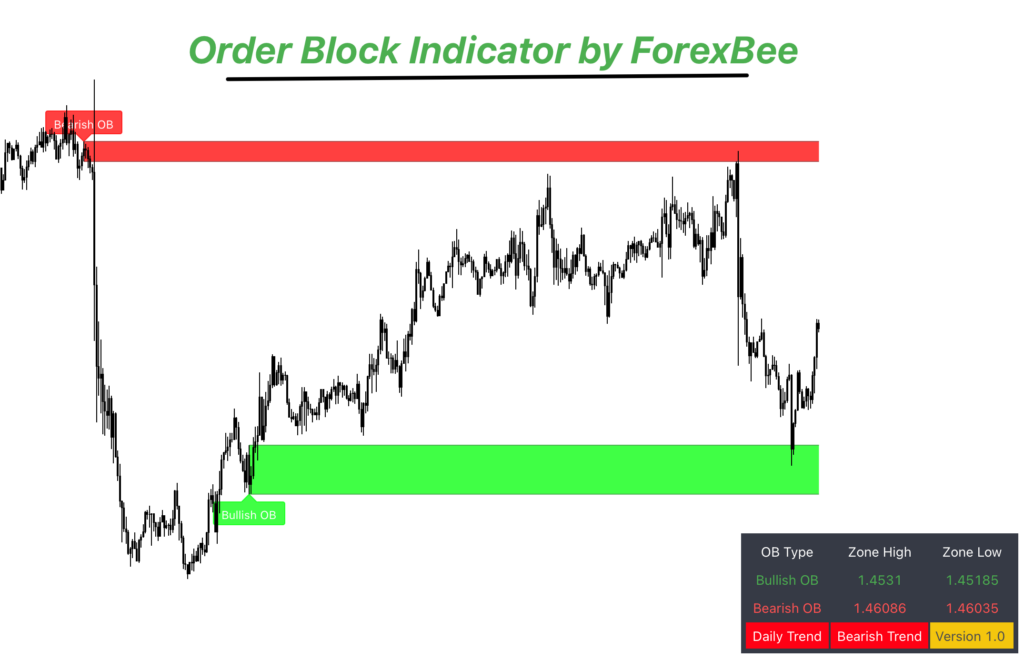
4. Order block indicator
The Order Block Indicator is all about understanding the balance and imbalance in the market using price action.
Here’s how it works:
- It’s rooted in natural market movements, making it quite reliable.
- There are two types: Bullish and Bearish blocks.
- Bullish Block: Imagine the market is quiet, moving sideways, then suddenly jumps up. That’s a Bullish block.
- Bearish Block: If the quiet market suddenly drops, a Bearish block has formed.
Why use it?
- It helps pinpoint accurate entry points in trades.
- It can tighten your stop-losses, potentially boosting your profits.
Who should use it?
- It’s great for swing traders and those looking at the long term.
- If you’re a scalper or into very short-term trades, this might not be ideal as its effectiveness reduces on shorter timeframes.
| Feature | Description |
|---|---|
| Type | Price action based |
| Main Concept | Balancing and Imbalancing of market prices |
| Key Patterns | Bullish and Bearish Blocks |
| How It Works | Bullish: Market moves sideways then rises. Bearish: Sideways then drops. |
| Advantages | Accurate entry points, tighter stop-losses |
| Recommended For | Swing traders, Long-term traders |
| Not Recommended For | Scalpers (due to lower effectiveness on short timeframes) |
| Price on Trading Platforms (like TradingView) | Paid on Tradingview |
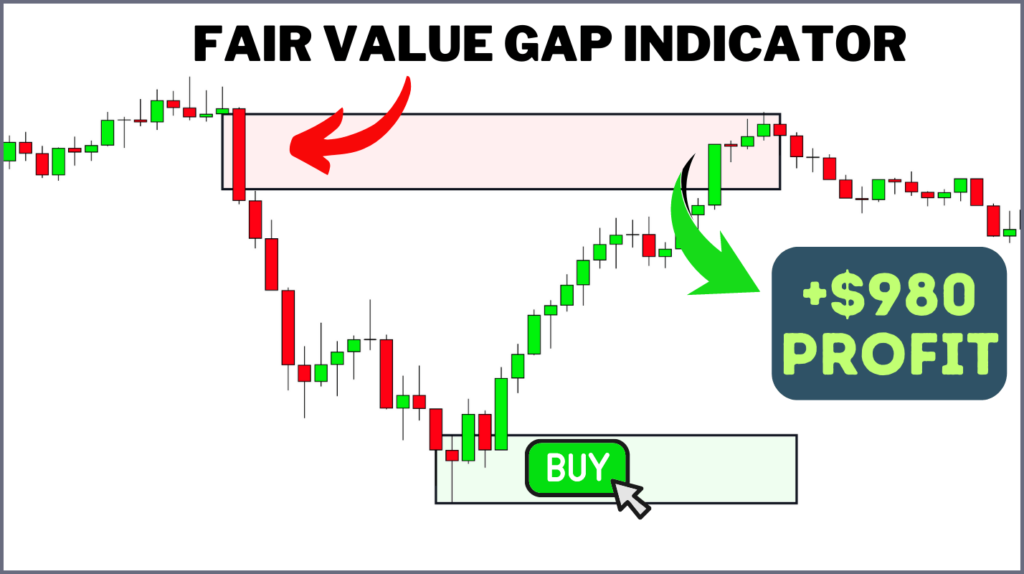
5. Fair value gap indicator
The Fair Value Gap (FVG) indicator is also a price action indicator that spots gaps or spaces on the chart. Think of these gaps like spaces waiting to be filled. Just like water flows to fill a hole, prices move to fill these gaps.
There are two main types: Overrated and Underrated gaps.
If an overrated gap appears, it means the current price is too high and might drop soon. On the other hand, an underrated gap suggests the price could go up.
Using the FVG helps predict where prices might head next. It’s like having a map that shows where prices want to go. Whether you’re a newbie or an expert, using the FVG can be a big help. It works on any timeframe and for all trading styles. Simply put, it’s a handy tool to have in your trading toolbox.
| Feature | Description |
|---|---|
| Type | Price Action-Based Indicator |
| Main Function | Identifies gap areas in the market, indicating spaces where price is likely to move in order to “fill” the gap. |
| Gap Types | Overrated and Underrated Fair Value Gaps. |
| Usefulness | Highlights market inefficiencies, allowing traders to anticipate price movements toward the ‘fair value’. |
| Trading Recommendations | When an overrated FVG appears, it suggests the asset’s price is higher than its fair value, implying a future price decline. Conversely, an underrated FVG suggests potential upward movement. |
| Suitability | Beneficial for traders of all types, given that fair value gaps can provide insightful market entry and exit points. |
| Timeframes | Universal applicability across all timeframes, from shorter intraday charts to longer-term daily and weekly charts. |
| Price | Paid on Tradingview |
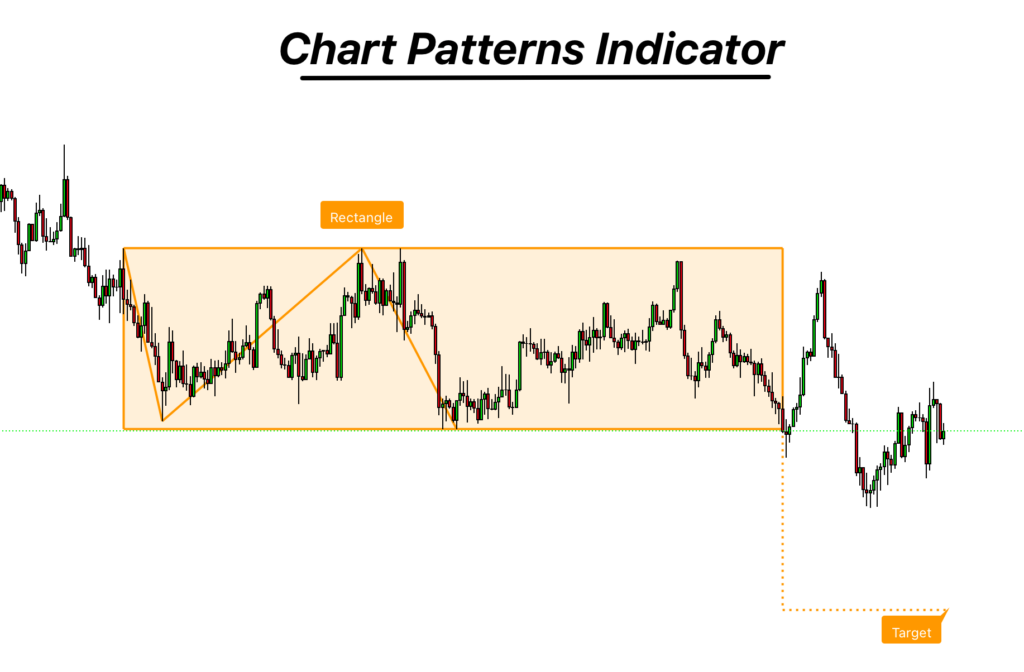
6. Chart or Candlestick Patterns Indicator
The Chart or Candlestick Patterns indicator is like reading the story of price movements. Each candlestick tells a tale of buyers and sellers battling it out.
Some patterns hint at rising prices, like the bullish engulfing or hammer. Others, like the bearish harami or shooting star, suggest prices might drop.
Using this indicator helps you see these patterns clearly. Instead of getting lost in the noise of the market, you can spot key patterns that give hints about what’s coming next.
It’s like having a translator for the market’s language. Whether you’re just starting out or have been trading for years, this indicator simplifies things. It points out the important patterns so you can make informed trades. In trading, knowledge is power, and recognizing these patterns gives you a valuable edge.
| Feature | Description |
|---|---|
| Type | Price Action-Based Indicator |
| Main Function | Identifies and highlights common chart or candlestick patterns |
| Key Patterns Detected | Doji, Hammer, Shooting Star, Engulfing, Bullish/Bearish Harami, and more. |
| Usefulness | Offers visual clues about potential future price movements. Patterns can signify reversals or continuations. |
| Trading Recommendations | Can be used to set entry, exit, and stop-loss points based on pattern confirmations. |
| Suitability | Beneficial for traders of all levels. Especially useful for those who want visual confirmations of market sentiment. |
| Timeframes | Works on all timeframes, but some patterns might be more significant on longer ones. |
| Price | Free on Tradingview |
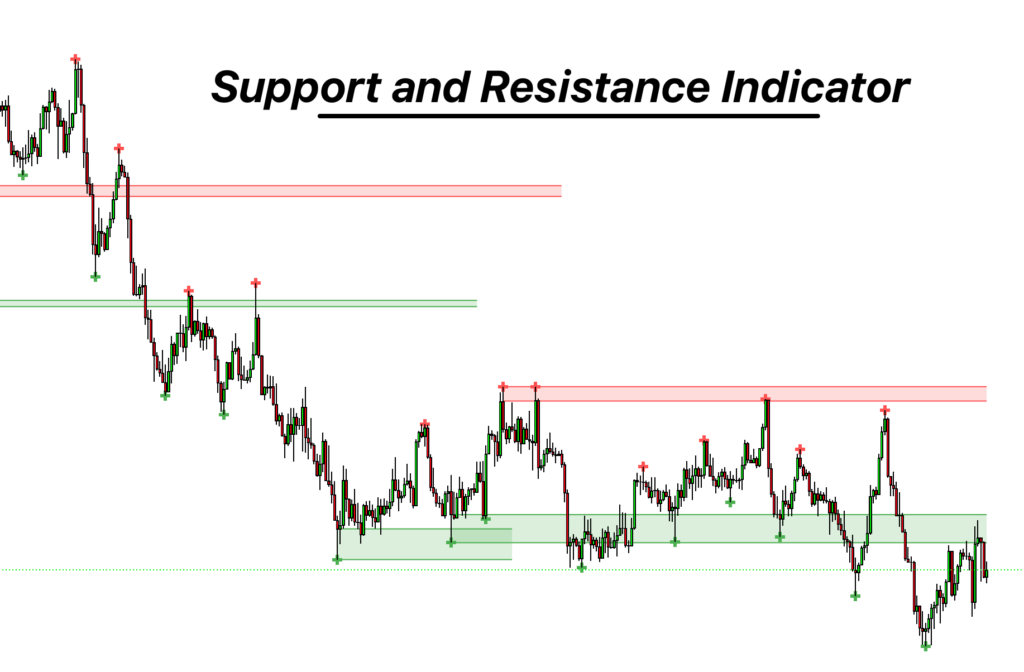
7. Support and Resistance Indicator
Support and Resistance: these two words are the backbone of technical analysis. This indicator simplifies the process of spotting these crucial zones on your chart.
At its core, the Support and Resistance Indicator identifies areas where price struggles to move higher (resistance) or lower (support). Think of these zones as barriers; they highlight points where the market hesitates.
But what’s even more useful? The breakout feature. When price breaks through one of these barriers, it often indicates a strong move in that direction. This can be a golden opportunity for traders.
The power of this indicator lies in its simplicity. By highlighting these areas, you get a clear map of potential market movements. Whether you’re planning an entry or setting a stop loss, this tool offers clarity in a sometimes-chaotic market. If you’re aiming to trade with better precision, the Support and Resistance Indicator should be part of your toolkit.
| Feature | Description |
|---|---|
| Type | Price Action-Based Indicator |
| Main Function | Pinpoints and visualizes key support and resistance zones on a chart. |
| Additional Function | Identifies breakouts from these zones, giving traders a heads-up on potential market movements. |
| Usefulness | Support and resistance levels are foundational in technical analysis, acting as barriers or targets for price. |
| Trading Recommendations | Zones can be used to set entry points (buy at support, sell at resistance), set stop-losses (below support or above resistance), and recognize potential trend reversals or continuations. |
| Suitability | Ideal for day traders, swing traders, and long-term investors as these levels are relevant across multiple timeframes. |
| Timeframes | Effective on all timeframes, from minute charts to monthly charts. |
| Price | Free on Tradingview |
Conclusion
Indicators are like tools in a trader’s toolbox. The price action indicators are great because they show us how the market moves. But remember, no tool does everything for you.
Don’t just use indicators and forget your own thinking. It’s best to mix it up – use these tools and also trust your own trading skills. Think about using a semi-manual system, where you use both the indicators and your own decisions. This can be a smart way to trade better.