
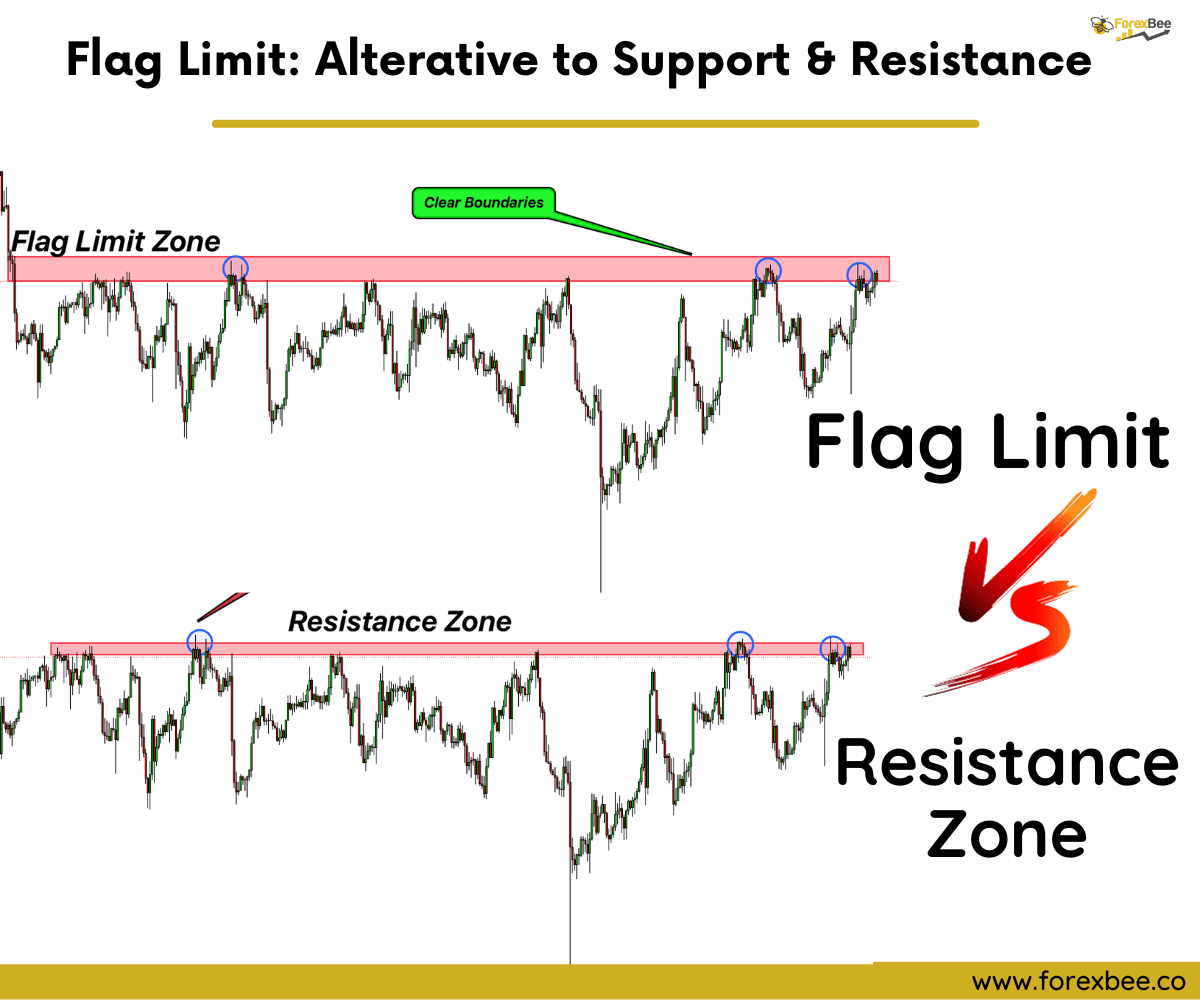
The Flag Limit Zone is the best and most advanced alternative to the support and resistance zones in trading. It is also represented as the FL zone.
We all start with understanding the basics like support and resistance, but there’s more out there. The Flag Limit Zone is that next step. While support and resistance are foundational, the FL Zone is the tool for those aiming for more effective live trading. It’s more than just a concept; it’s a strategy that can enhance your trading results. Every trader, whether beginner or expert, can benefit from adding this to their approach.
In this article, we’ll explore the Flag Limit and discuss why it’s better than traditional support and resistance. We’ll highlight its key benefits in trading and back it up with some real backtest results for clarity.
Why Traders Should Choose the Flag Limit
I have explained the top 4 reasons to use a flag limit instead of a support resistance zone in trading.
- Origin & Boundaries:
- Support and resistance can be drawn anywhere the price bounces.
- Flag Limit has a set start point, based on trading patterns like rally-base-rally and drop-base-drop.
- Drawing Zones:
- For support and resistance, traders use different methods: some use closing prices, others use highs or lows. It’s inconsistent.
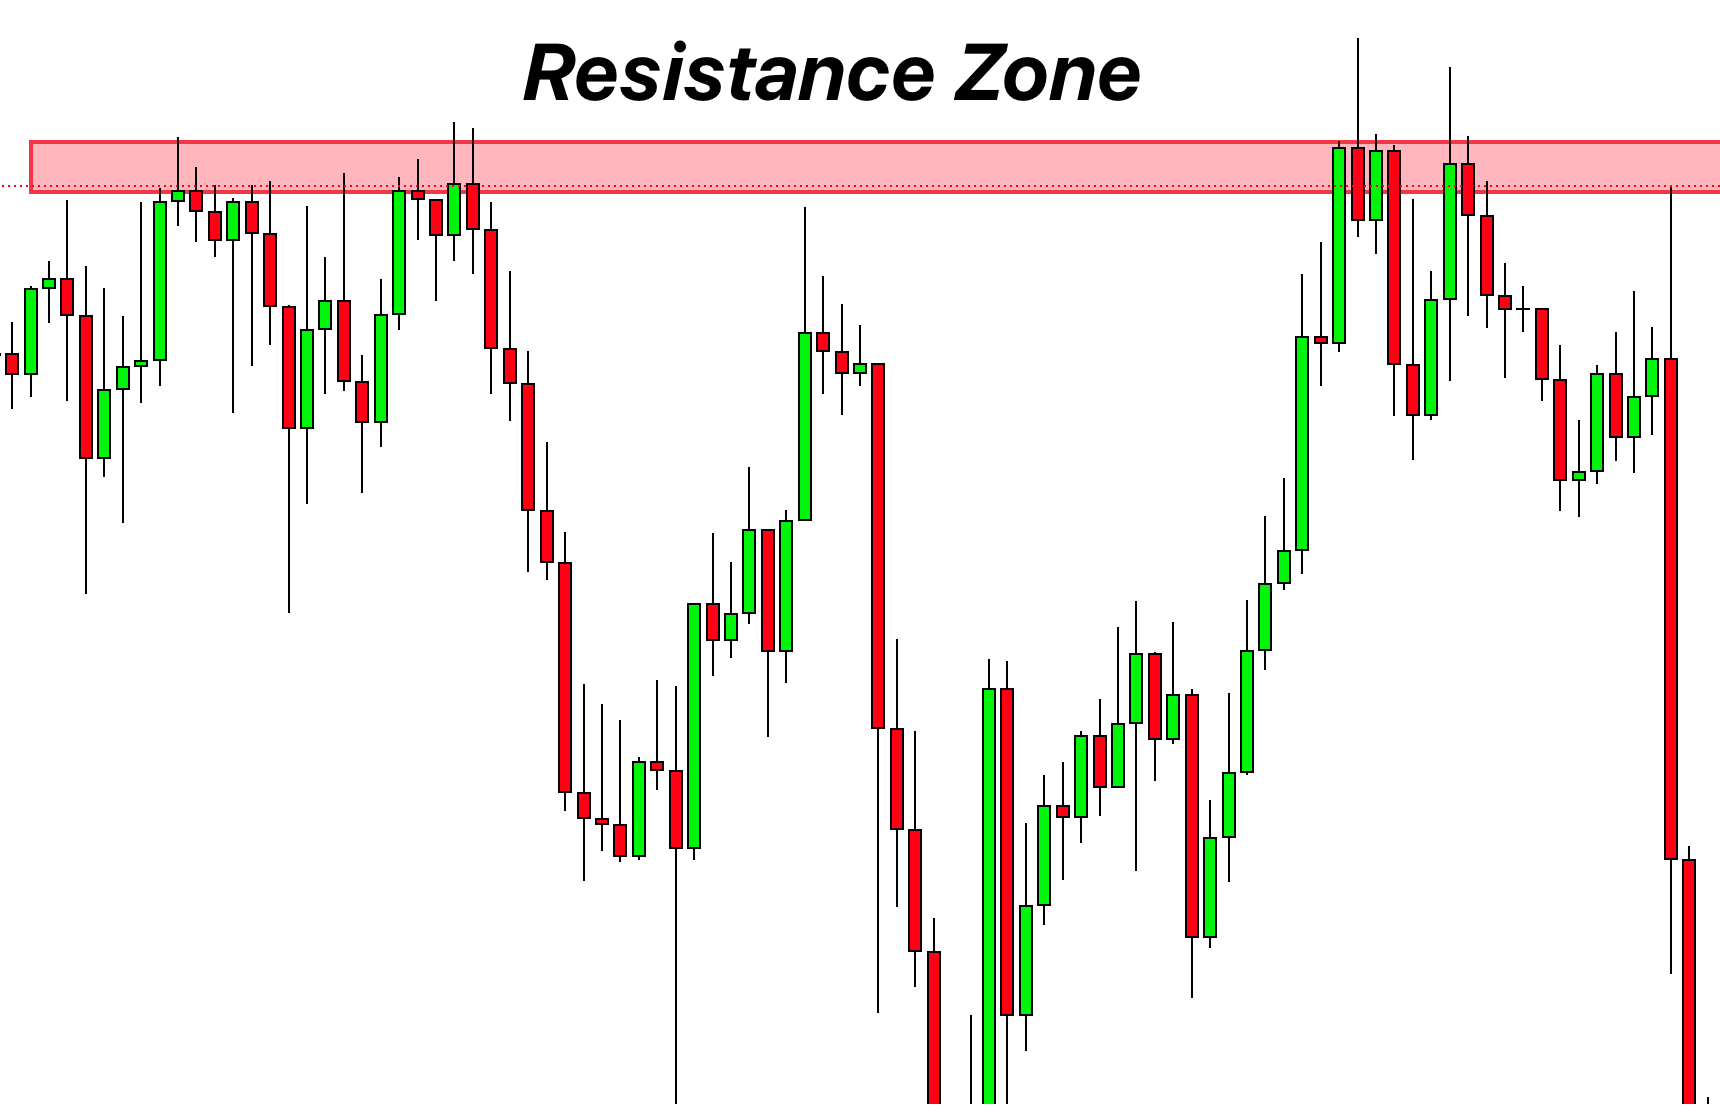
- Flag Limit uses the high and low of a base area, making it clearer and more uniform.
- For support and resistance, traders use different methods: some use closing prices, others use highs or lows. It’s inconsistent.
- Trade Decisions:
- Support and resistance zones can be unclear, especially after false breakouts. This makes setting stop-loss and take-profit tricky.
- With Flag Limit, if there’s a breakout, the zone isn’t valid anymore. This clarity helps in setting clear stop losses and take profits.
- Ease of Use:
- Drawing support and resistance can get confusing due to various rules.
- Flag Limit is simpler, based on clear trading patterns.
To sum it up, the Flag Limit gives traders a clearer, more straightforward way to plot zones compared to traditional support and resistance. It’s a reliable choice for those seeking simplicity and consistency.
I hope you now see why the Flag Limit (FL) is better than the usual support and resistance zones. It’s like an upgraded version of S and R zones.
Flag Limit: What is it and its Types
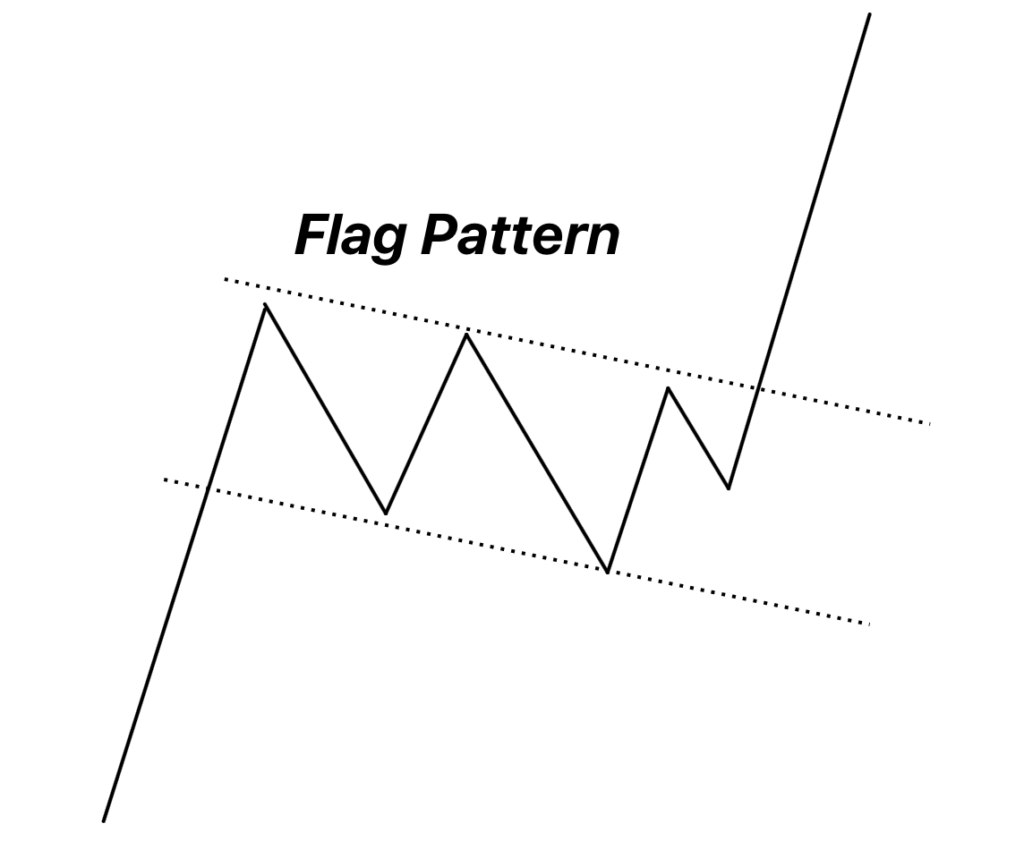
The Flag Limit is a concept from price action trading that’s tied to flag patterns. Think of it like this: after a strong price movement, there’s often a smaller move back – kind of like a flag forming after a pole. It’s this “flag” area we’re interested in.
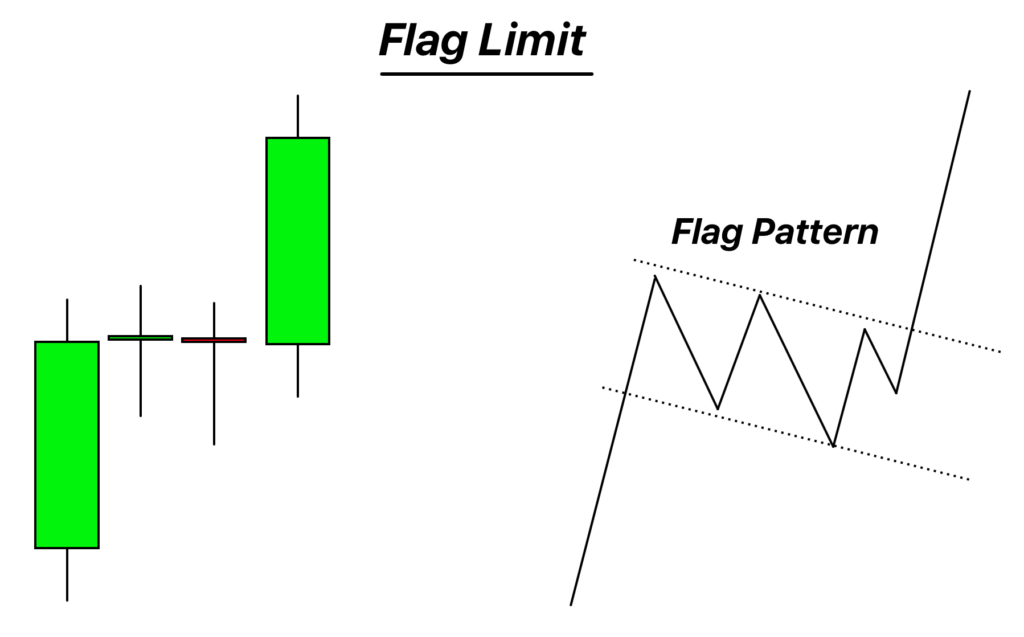
Example & Formation:
After a big price jump (an impulsive wave), prices might pull back a bit (a retracement wave). This pullback often looks like a flag.
This “flag” part? That’s what we call the Flag Limit. If you’ve heard of the “rally base rally” pattern, the base is where this flag forms.
Types of Flag Limits
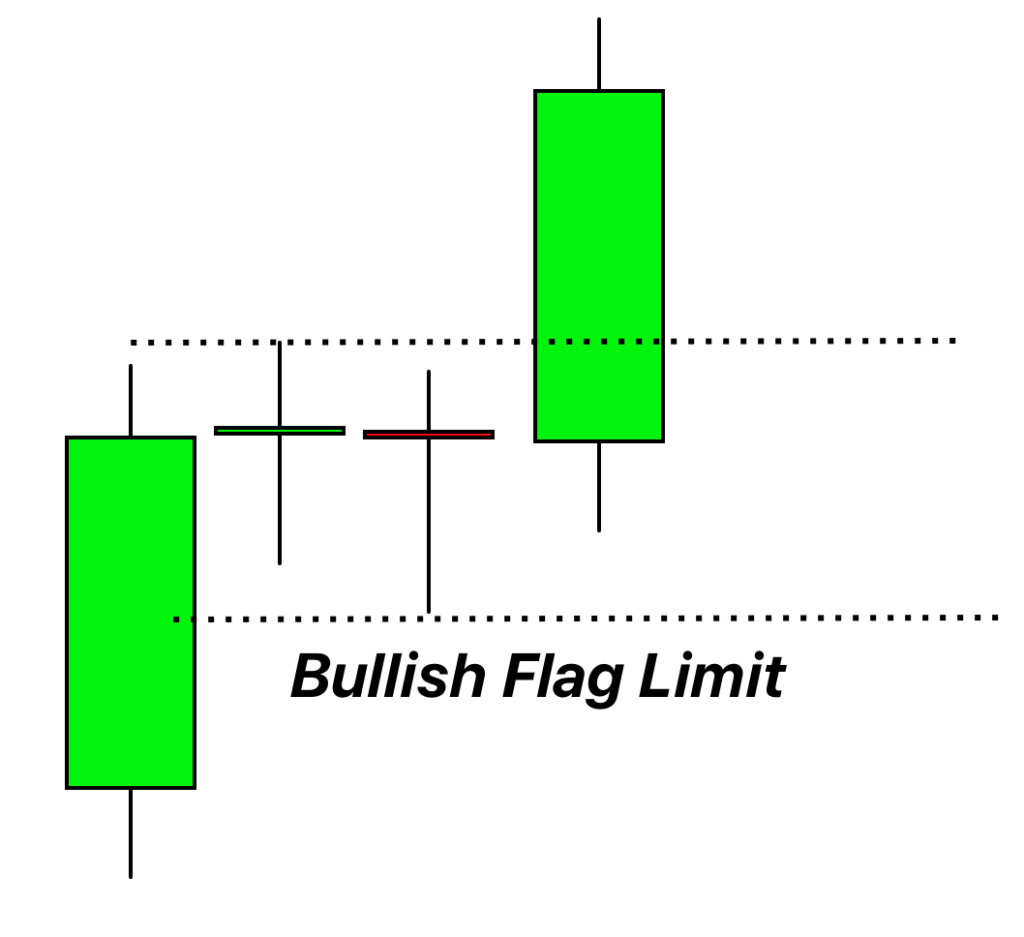
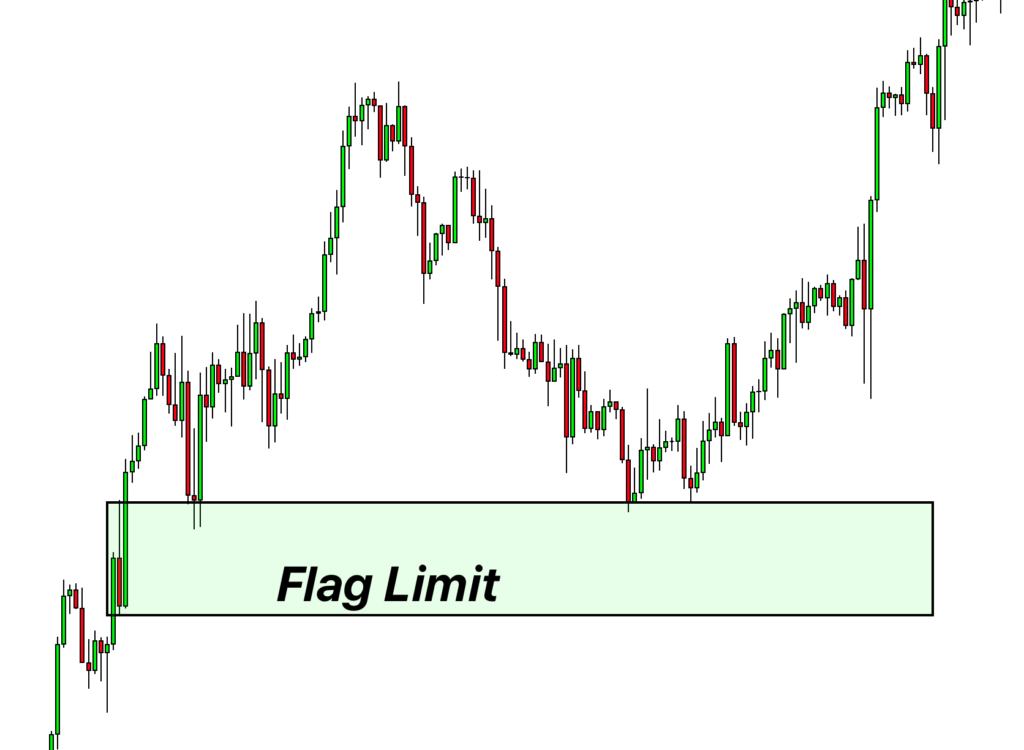
1. Bullish Flag Limit:
Here, you see a pattern of “rally-base-rally.”The Flag Limit is drawn on the “base” of this pattern.
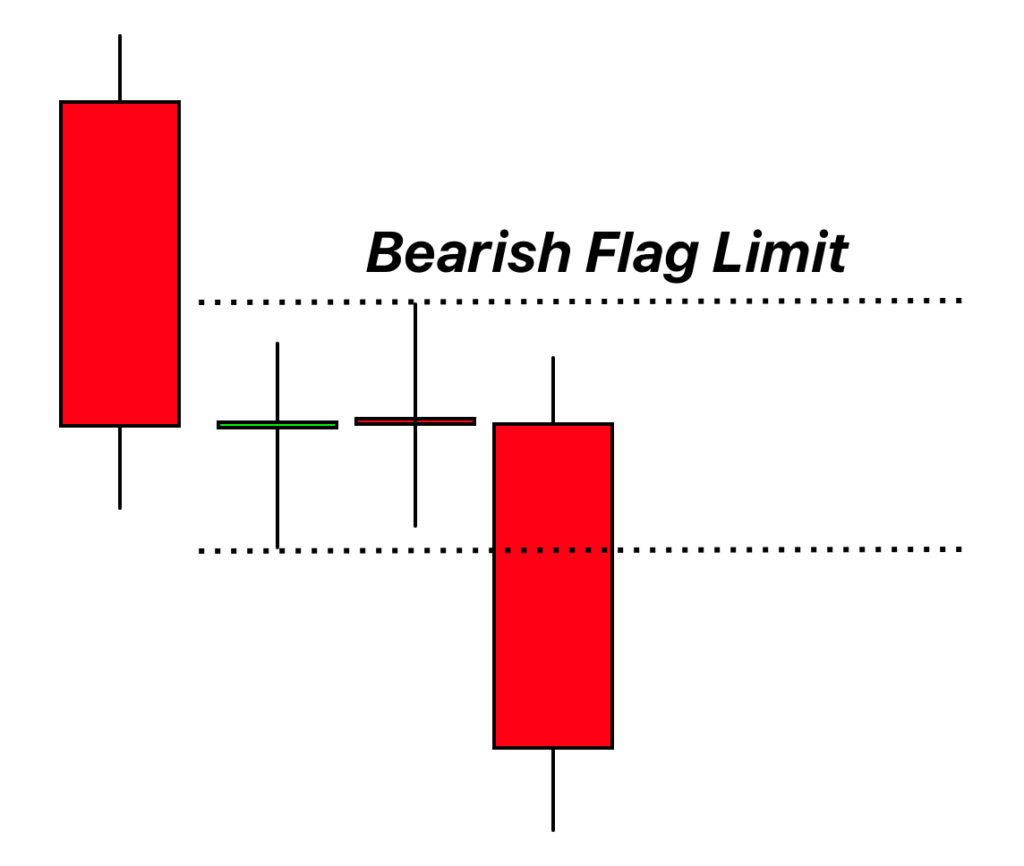
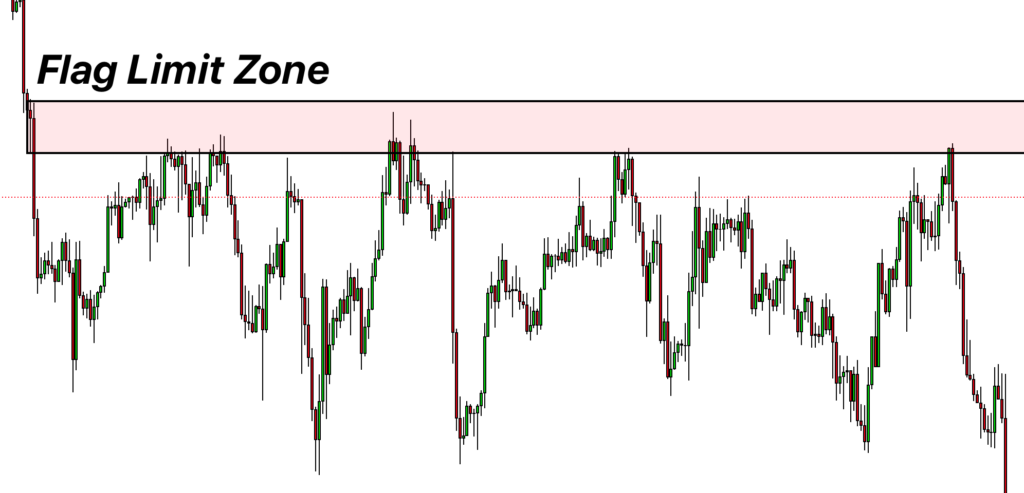
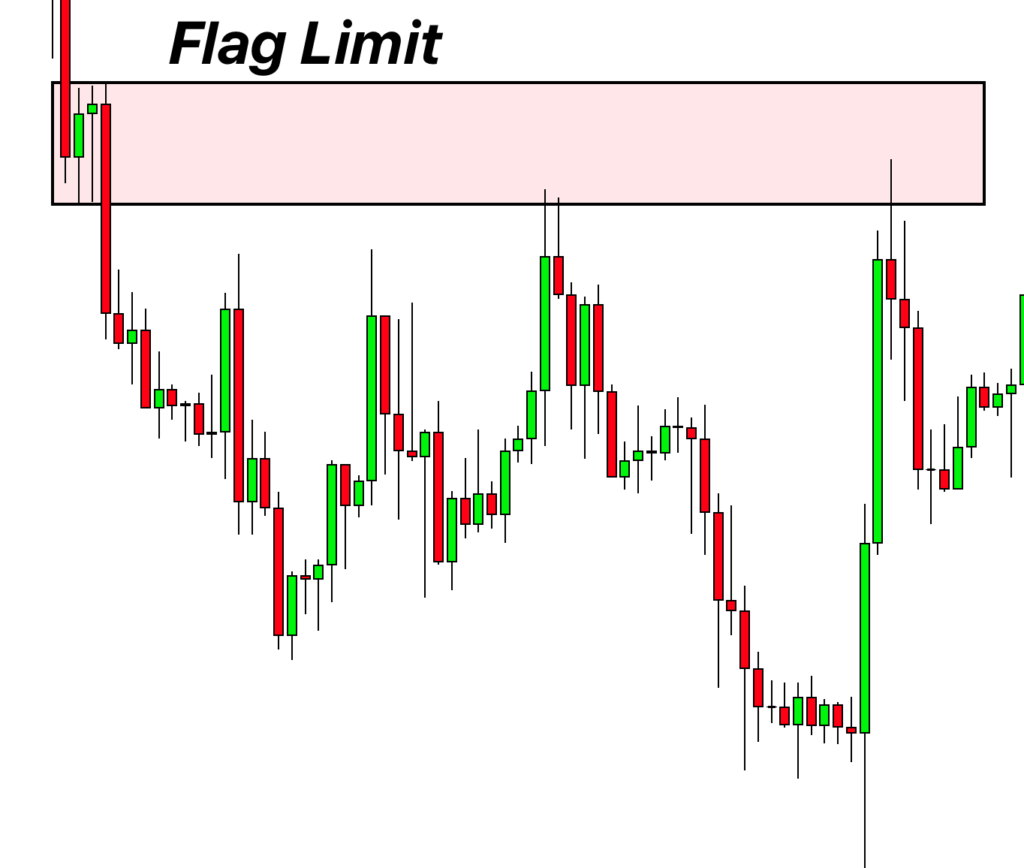
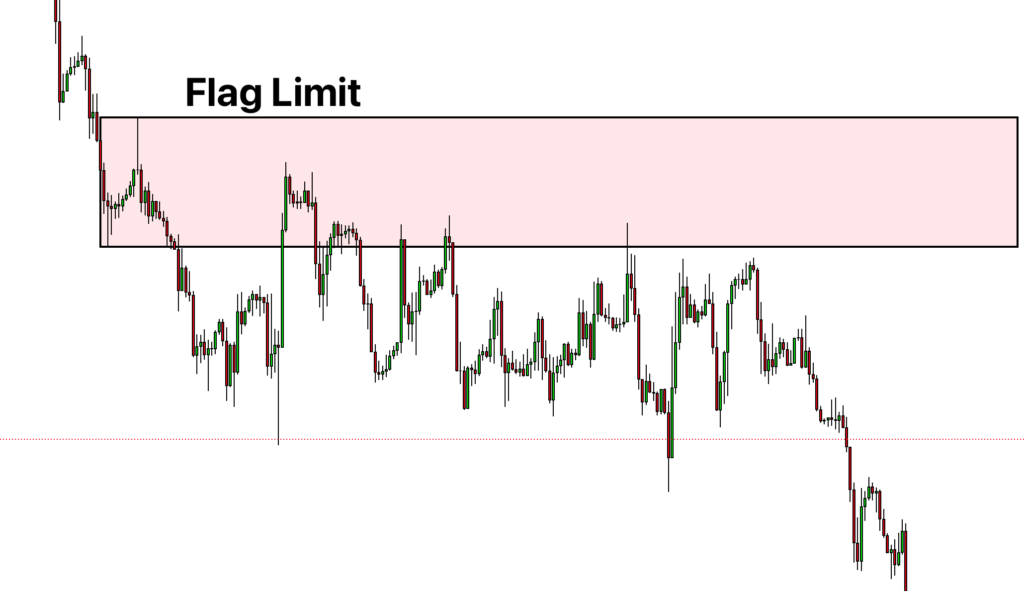
2. Bearish Flag Limit:
This is the opposite. The pattern is “drop-base-drop.” The Flag Limit is drawn on the “base” part of this pattern.
In short, the Flag Limit focuses on the smaller pullback (or “flag”) after a bigger price move. And depending on if prices went up or down, we’ve got bullish or bearish Flag Limits to look for.
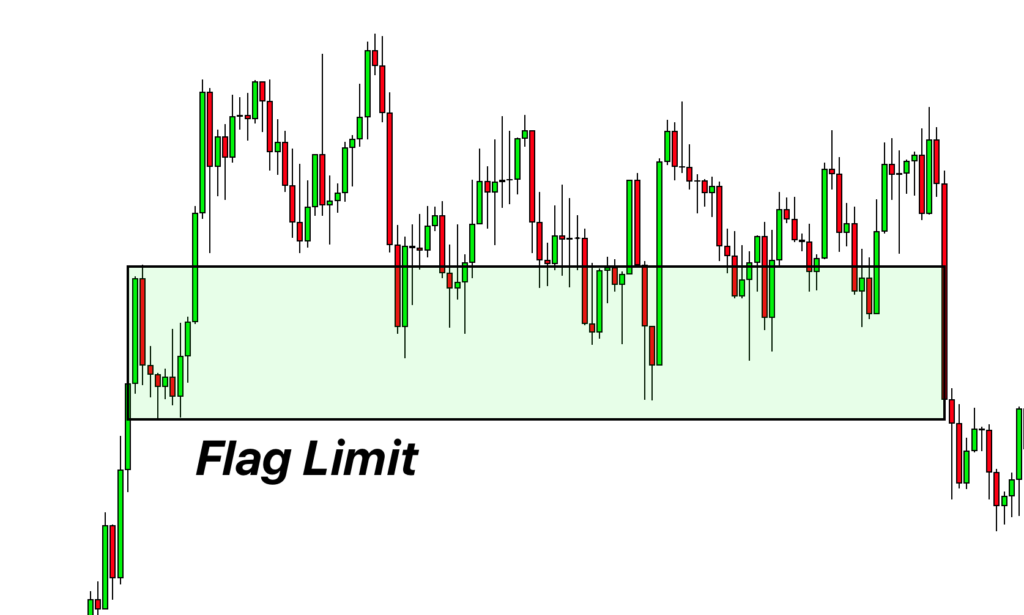
How to draw the Flag Limit Zone on Your Chart
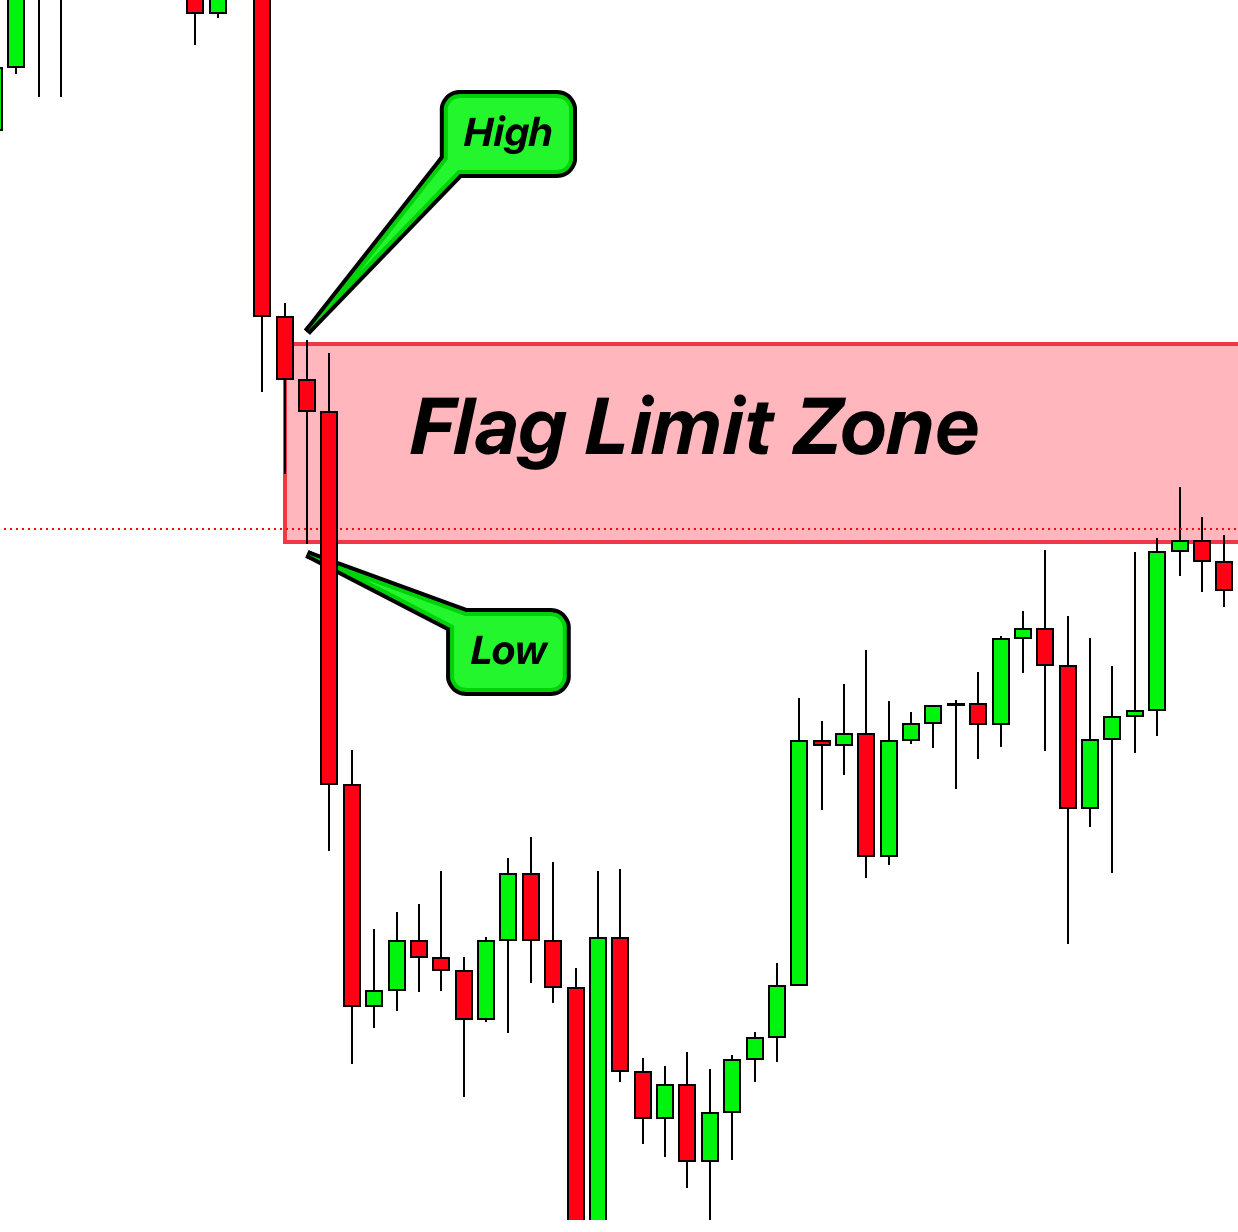
When we talk about the base region, we’re looking at the place on the chart where the candles are smaller and closer together, especially after we’ve seen a big price movement. If you’re not quite sure about this, it might help to look back at articles or information about “rally base rally” and “drop base drop“.
Now, when you’re ready to draw the Flag Limit Zone, here’s what you do:
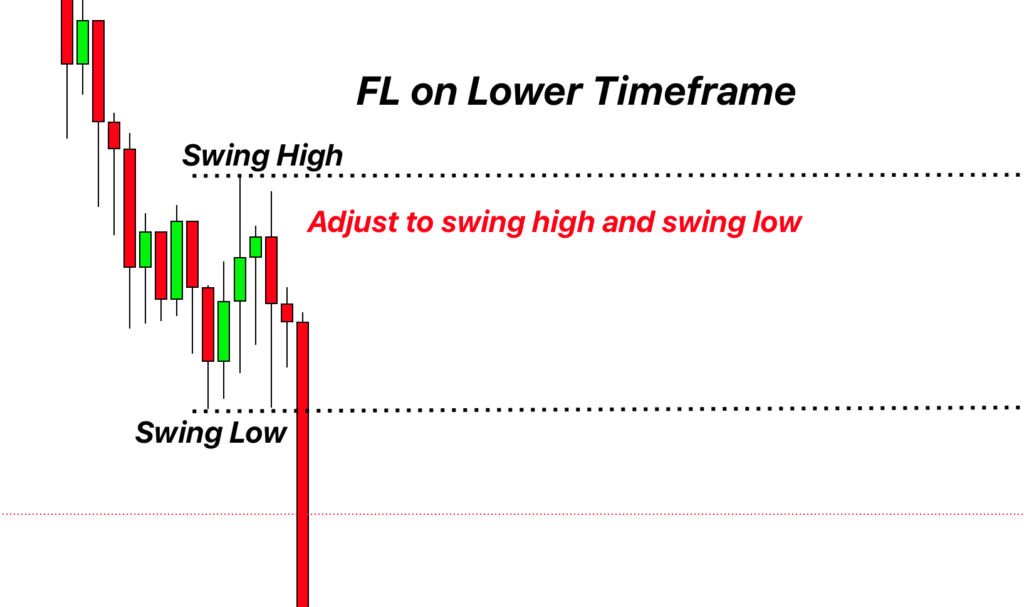
- Look for the highest and the lowest point of those smaller base candles.
- If you want to be extra sure about those points, you can switch to the lower timeframe for a better and more detailed view.
- Once you’ve got those points, draw a zone that connects them and then Extend that zone to right.
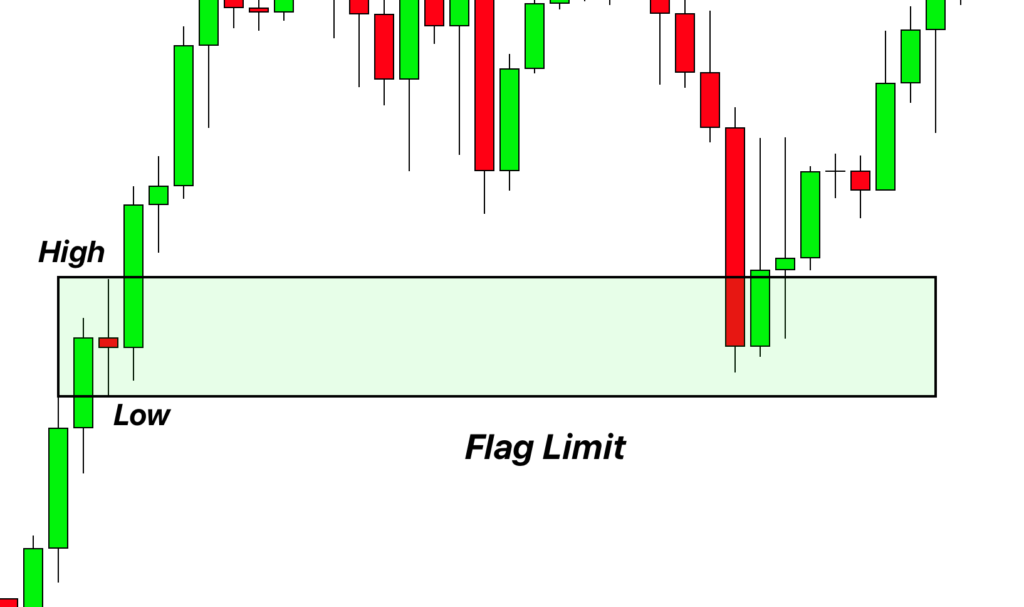
And that’s it! By following these steps, you’ve got your Flag Limit Zone on the chart.
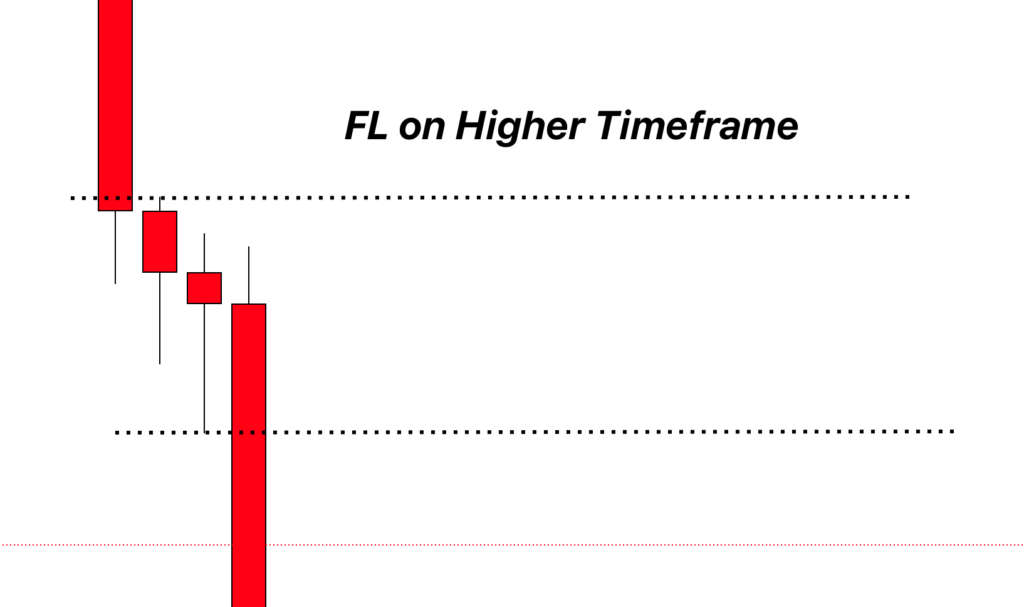
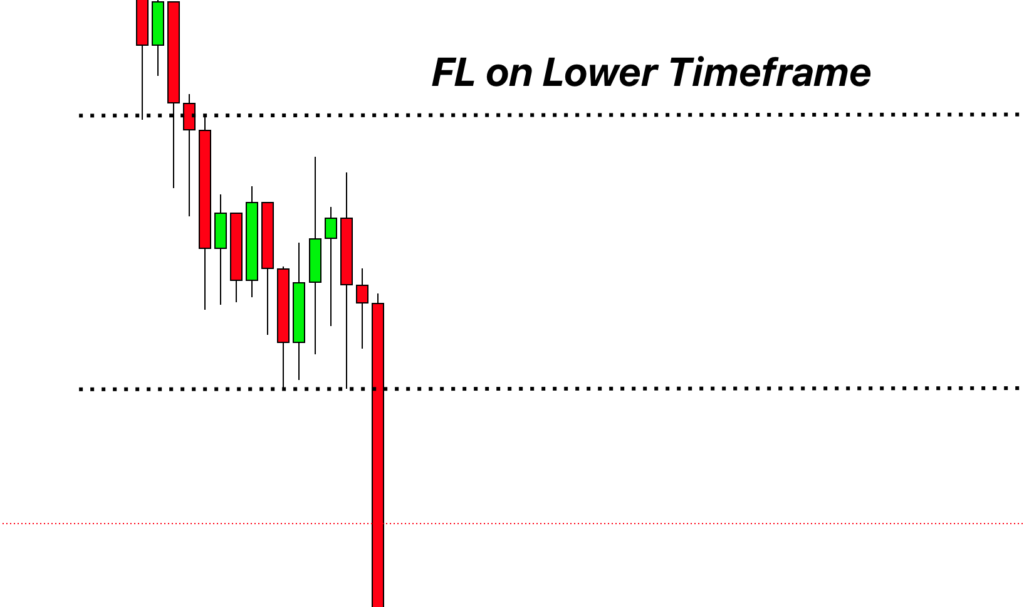
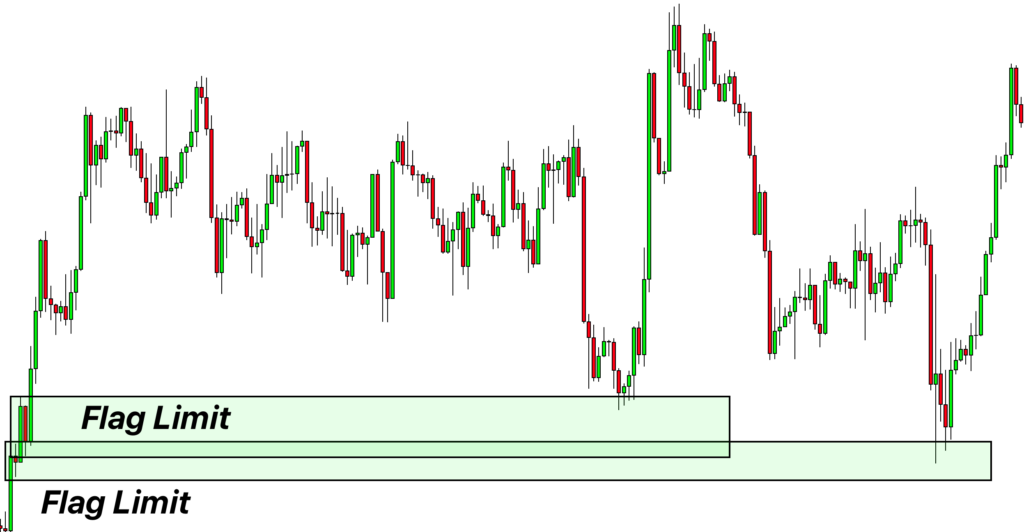
Analyzing on a Lower Timeframe
Once you’ve identified a Flag Limit on a higher timeframe, it’s essential to switch to a lower timeframe for a closer look. The higher timeframe might not show every market move. By zooming into a lower timeframe, you can observe detailed swing highs and lows that are in line with the primary Flag Limit. This approach allows you to make necessary adjustments to your trading zone for better accuracy.
Trading the Flag Limit Zone
Using the Flag Limit Zone for trading is straightforward. But, adding extra factors or “confluences” with the Flag Limit can boost your trade’s success chances.
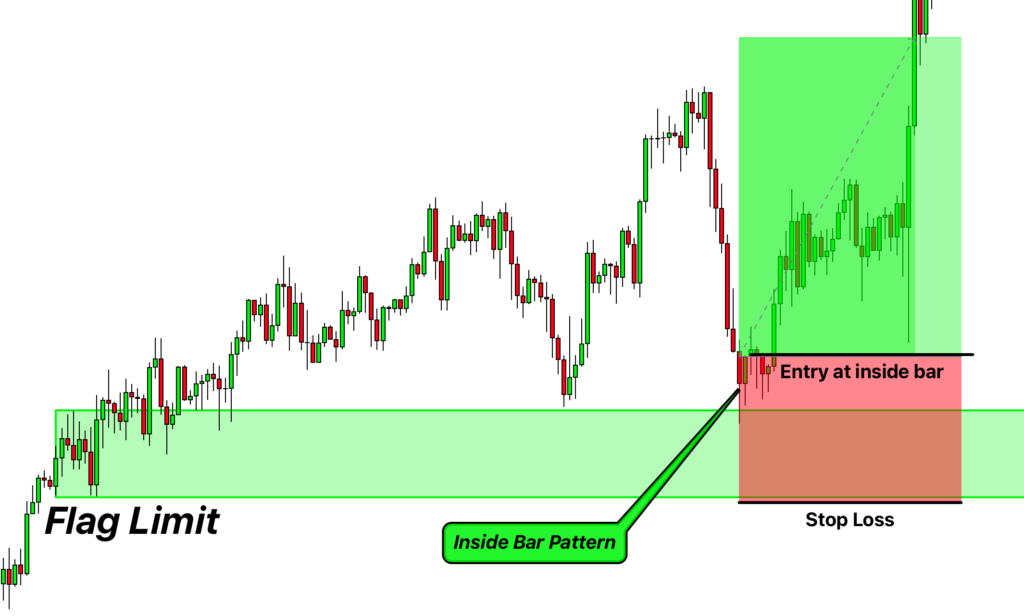
For a Buy Trade
- Wait until the price hits the bullish Flag Limit Zone.
- Look for signs that the trend is about to turn bullish. This could be patterns like a bullish engulfing candle, a pin bar, or an inverse head and shoulders pattern.
- Once you spot these signals, open a buy trade.
- Set your stop loss slightly below the lowest point of the Flag Limit Zone.
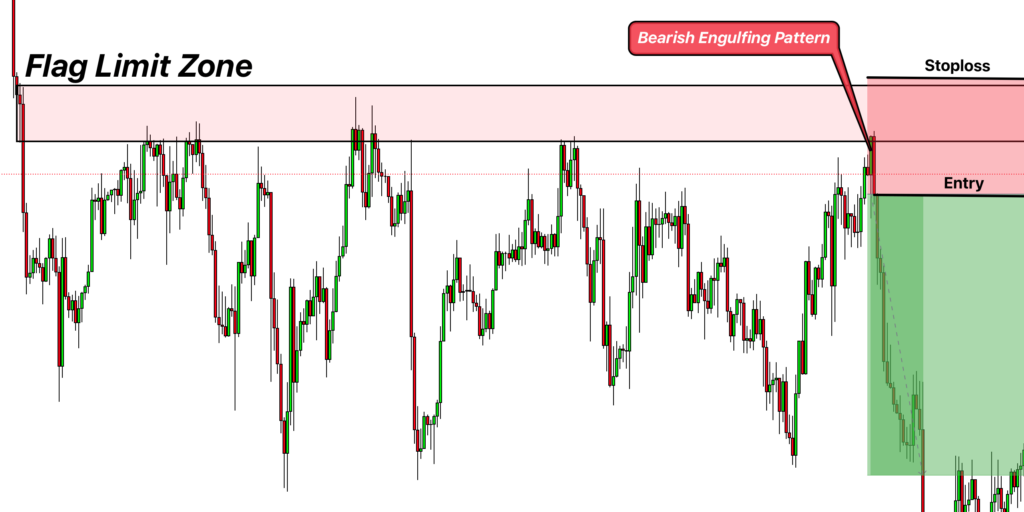
For a Sell Trade
- Monitor until the price touches the bearish FL Zone.
- Watch out for patterns signaling a bearish trend reversal.
- Upon confirmation, initiate a sell trade.
- Position your stop loss just above the highest point of the FL Zone.
While this approach offers a direct way to trade using the Flag Limit Zone, you can integrate it into various trading strategies. It’s a versatile tool to spot potential trend reversals on your charts.
Identifying a Strong Flag Limit Zone
In trading, our goal is to enhance our chances of winning. To do that, we often look for additional confirmations and lean on past data, like backtest results.
Backtest Insights: From backtesting, we’ve seen that a Flag Limit Zone tends to gain strength after it’s been tested a couple of times. This behavior is similar to what we observe with traditional support and resistance zones. Therefore, before trusting a Flag Limit Zone, ensure it has been tested at least twice. This double-check adds an extra layer of confidence to your trading decisions.
Pro Tip: Just like when support or resistance levels get touched often and become strong, they tend to break eventually. Similarly, when a Flag Limit Zone gets hit multiple times, it can hint that the market might be gearing up to break through it. So, keep an eye out! If a Flag Limit Zone is touched many times, it might be getting ready for a breakout.
Backtest Results
Here are the few backtest results that will help you spot better and valid FL zones on the chart. Explore a flag limit on multiple timeframes to learn more.
01. Flag limit Example
02. Flag limit Example
03. Flag limit Example
04. Flag limit Example
05. Flag limit Example
06. Flag limit Example
Conclusion
In trading, the Flag Limit zone offers a more refined approach than traditional support and resistance levels. By focusing on the Flag Limit, traders can potentially get more accurate entry and exit points, enhancing their trading strategies and increasing success rates.
I will highly recommend intermediate and advanced traders to learn flag limit and take benefit from this technical tool.
if you have any question, please comment below.