
Introduction
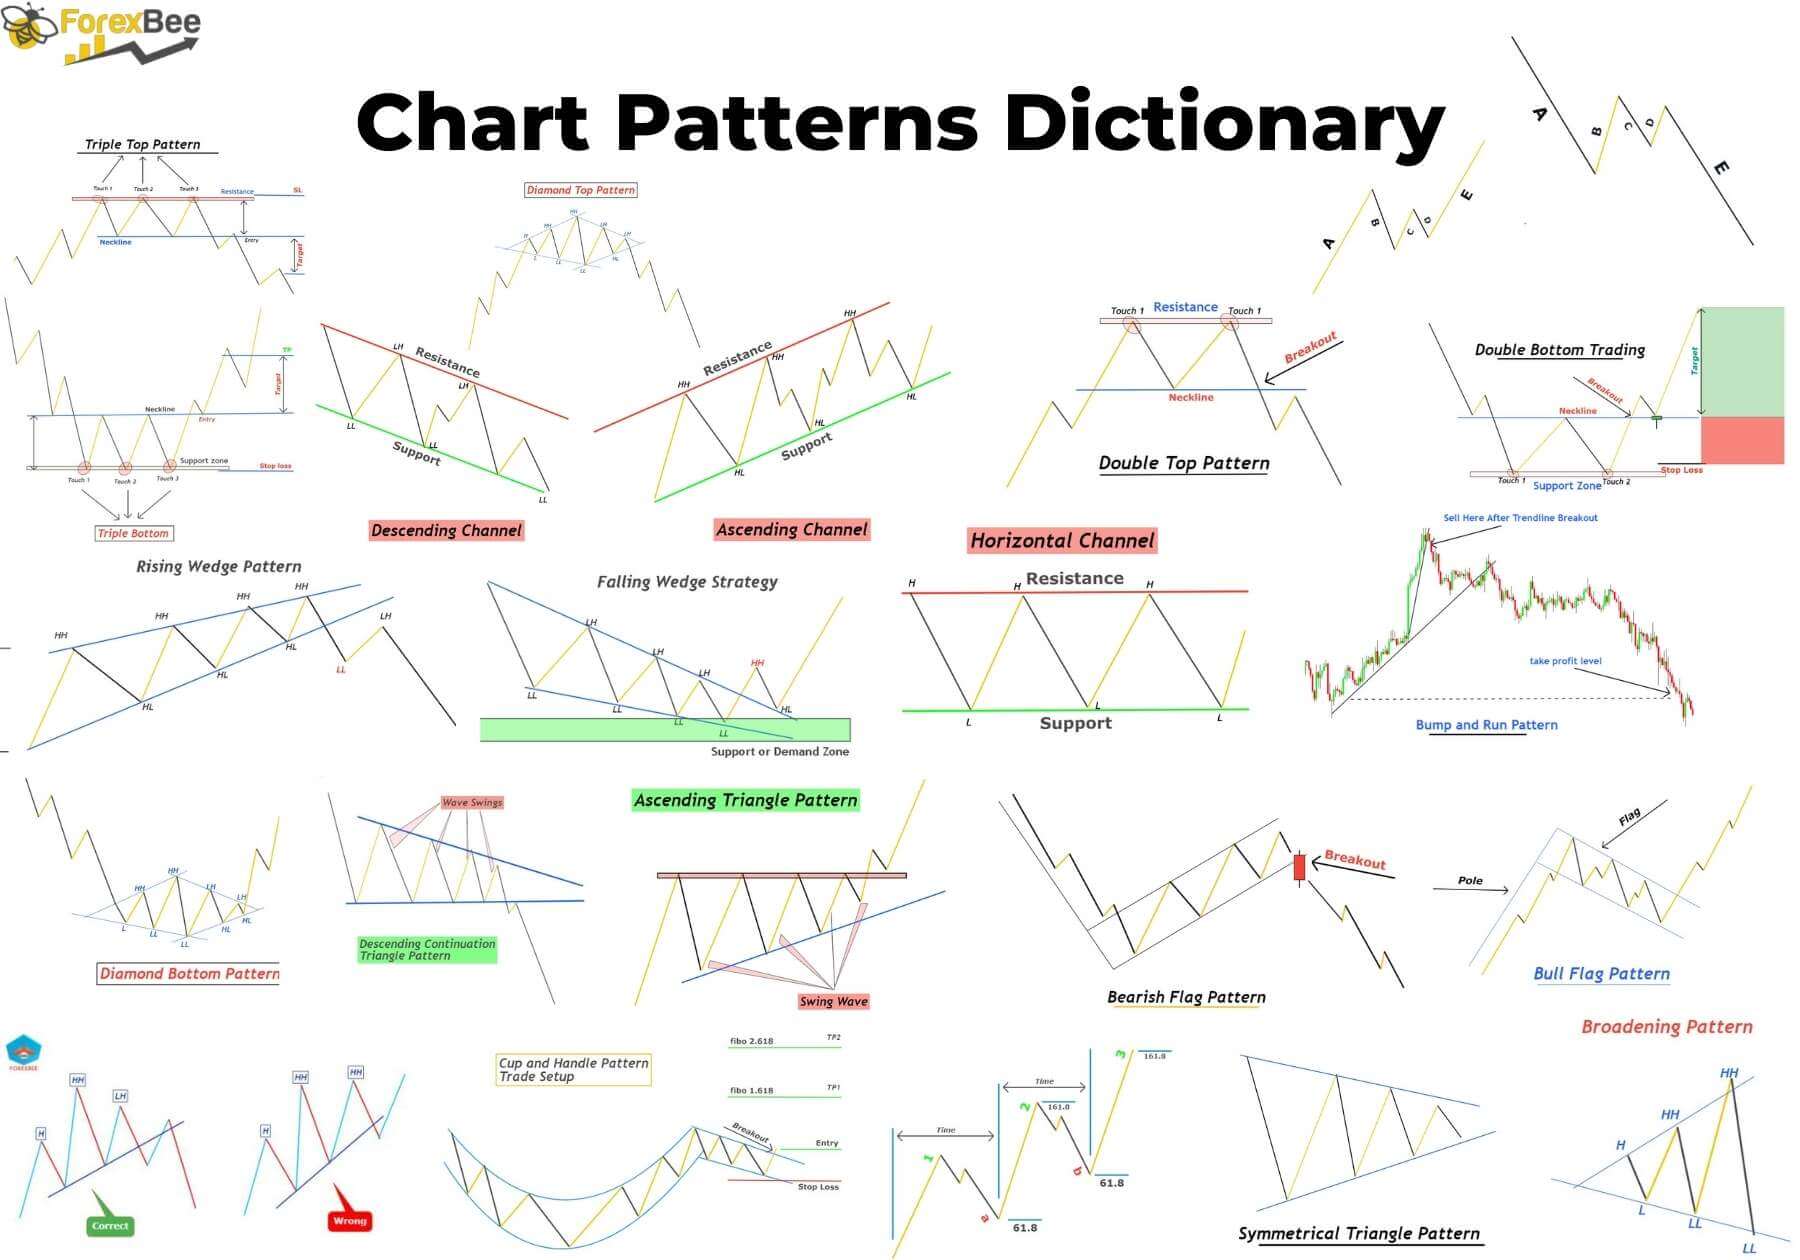
Twenty-four chart patterns have been discussed in this post. Retail traders widely use chart patterns to forecast the price using technical analysis.
In this article, you will get a short description of each chart pattern. You can also learn the chart patterns with trading strategy by pressing the learn more button. At the end of the article, you will get a chart patterns PDF download link for backtesting purposes.

What are chart patterns?
Chart patterns are the natural price patterns that resemble the shape of natural objects like triangle patterns, wedge patterns, etc. These patterns repeat with time due to natural phenomena. Traders use these repetitive patterns to forecast the market.
Chart patterns are made up of price waves or swings on the candlestick chart, such as head and shoulder, double top, and triple top patterns.
Types of chart patterns
Chart patterns are categorized into two primary types based on the trend direction.
- Bullish chart patterns
- Bearish chart patterns
These two patterns are classified into many chart patterns based on the shape and structure of the market.
List of top 19 chart patterns
There are several repetitive chart patterns in the technical analysis, but here I will explain only the top 24 chart patterns. These patterns have a high winning probability.
Double top
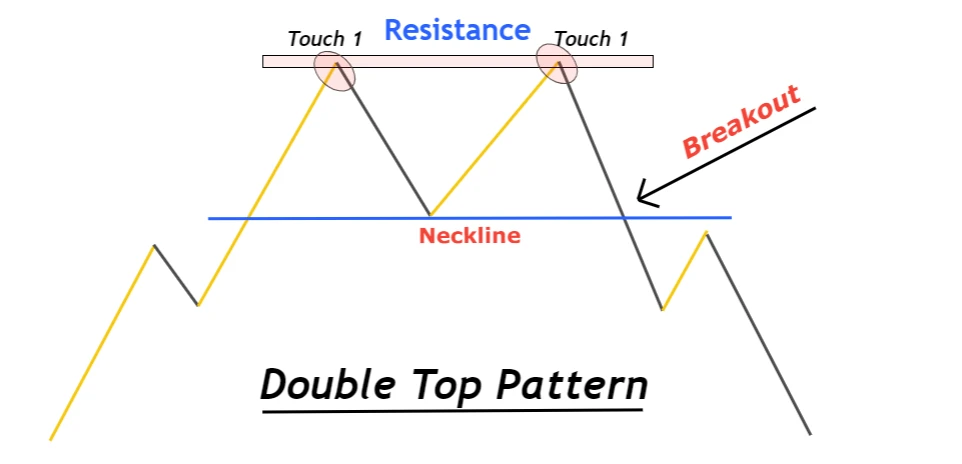
The double top is a bearish reversal chart pattern that shows the formation of two price tops at the resistance level. After the neckline breakout, a bearish trend reversal happens.
The neckline is drawn using the last swing low after two tops. The prior trend to the double top pattern should be bullish, and it must form at the end of the bullish trend.
This chart pattern changes the trend from bullish to bearish.
Double bottom
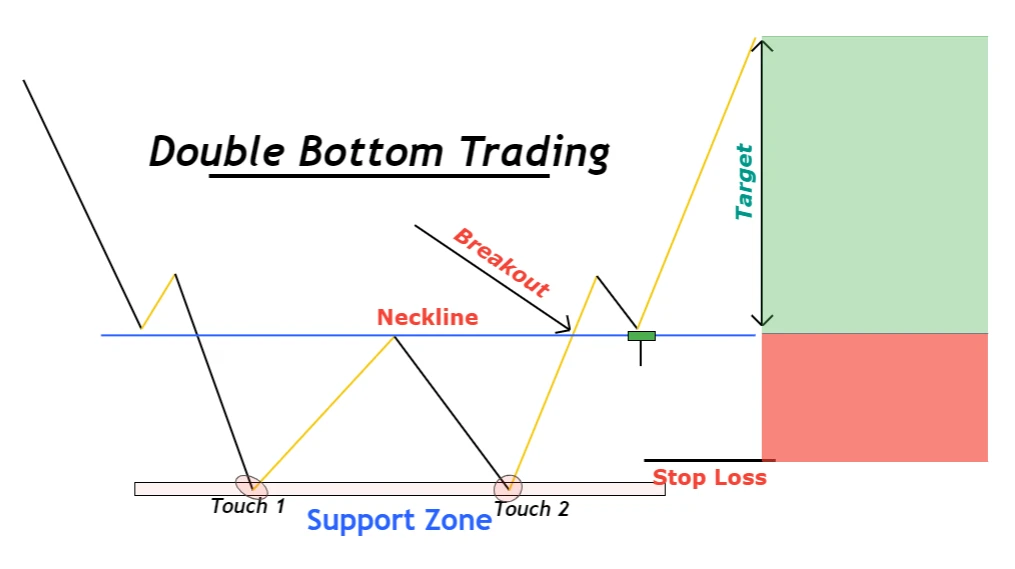
The double bottom is a bullish reversal chart pattern that indicates the formation of two consecutive lows at the support zone. After the neckline breakout, a bullish trend reversal happens.
The neckline is drawn at the last price swing after two price bottoms in this pattern. The prior trend to the double bottom pattern should be bearish, and it must form at the end of the bearish trend.
The chart pattern changes the price trend from bearish to bullish.
Triple top
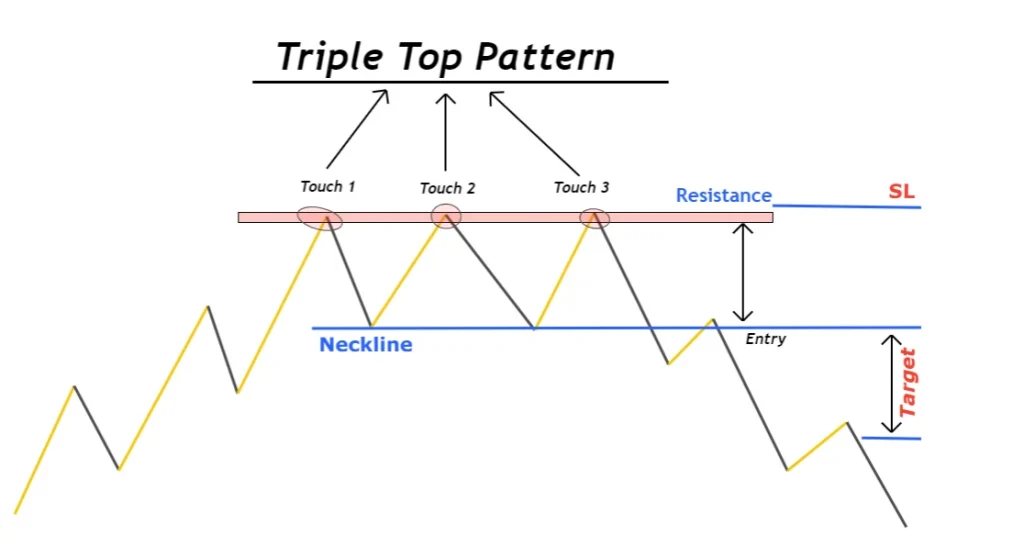
The tripe top is a bearish reversal chart pattern in which price forms three consecutive tops at the same resistance level. It is the most basic chart pattern, and traders widely use it in technical analysis.
The neckline forms after connecting the last two swing lows with a trend line in this pattern. The trend line breakout confirms the triple top pattern.
This chart pattern turns the trend from bullish into a bearish price trend.
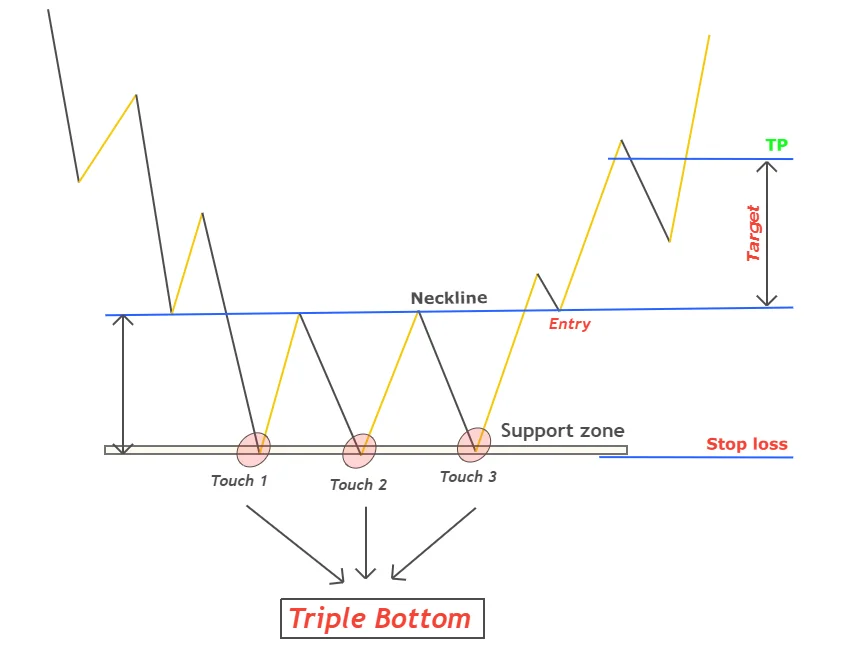
Triple bottom
The triple bottom is a bullish reversal chart pattern in which price forms three consecutive bottoms at the same support level.
To learn to trade triple bottom patterns, you should first understand the price swings and impulsive waves.
The neckline forms in the triple bottom pattern after connecting the last two swing highs with a trend line. The breakout of this trendline confirms the trend reversal from bearish into bullish.
Head and shoulders pattern
The head & shoulder is a reversal chart pattern that consists of three price swings. The highest price swing is called the head, and the other two waves on the left and right of the head are called shoulders. That’s why it is named as head and shoulder pattern.
It is a repetitive chart pattern, and after its formation, a bearish trend reversal happens in the market.
The inverse head and shoulder pattern is opposite to this pattern, and it is a bullish trend reversal pattern.
A neckline also forms during this pattern. The breakout of the neckline always confirms the trend reversal.
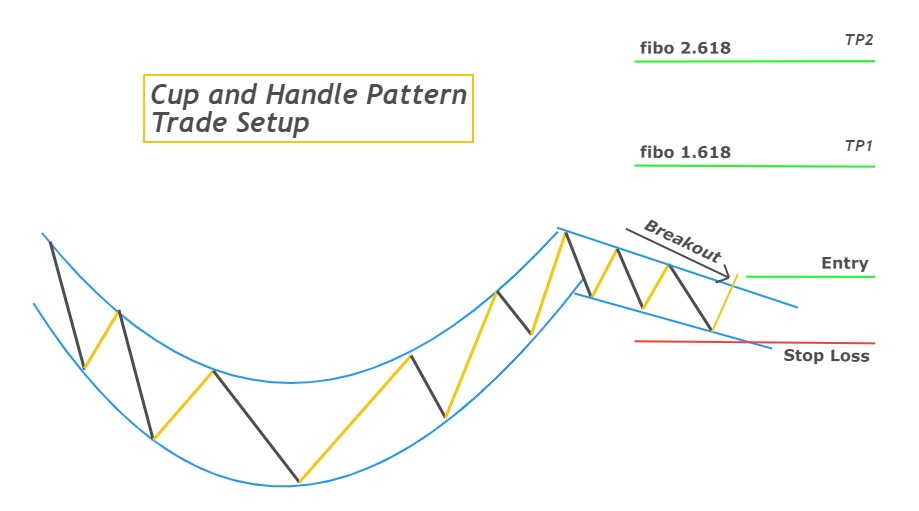
Cup and Handle chart Pattern
The cup & handle is a continuation chart pattern in which price forms a round bottom with a handle shape at the end of the pattern.
This chart pattern can also act as a trend reversal pattern. It depends on the location either it forms during a bullish trend or begins at the end of the bearish trend.
The inverse cup and handle is the opposite chart pattern, indicating a bearish trend.
It would be best to keep in mind that there is a clear difference between a V-shape wave and a round bottom wave. A rounded bottom forms rarely on the price chart. That’s why you should backtest this pattern correctly.
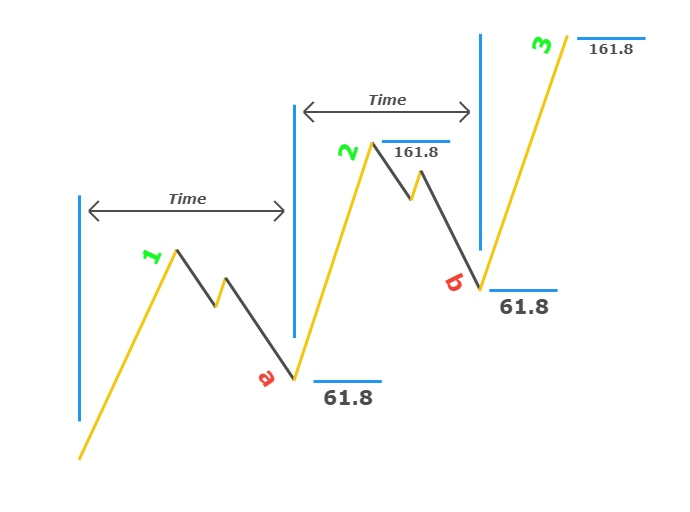
Three drives chart pattern
It is a reversal chart pattern that shows three consecutive attempts of big traders to break or approach a specific key level. After that, a trend reversal in the market occurs.
Based on trend direction, it is further divided into two types
- Bullish three drive
- Bearish three drive
The 3-drive chart pattern consists of three impulsive waves and two retracement waves. The number three is also a Fibonacci number, and it has much importance in trading. That’s why the three-drive pattern is also a natural phenomenon.
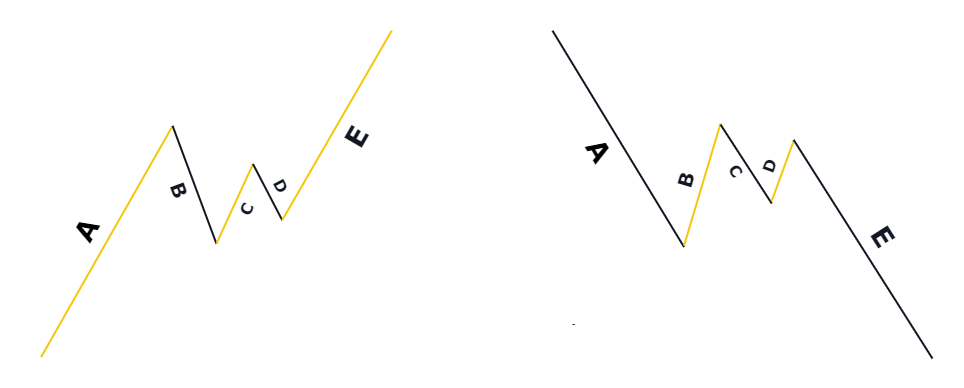
Pennant chart pattern
Pennant is a continuation chart pattern with five waves ABCDE. It shows the trend continuation after a minor pause in the trend.
This chart pattern consists of two impulsive waves and three retracement waves. During the retracement wave, the market consolidated inwards, indicating indecision in the market. After indecision, when the price breaks in the trend, the trend continues.
The small inward consolidation and impulsive prior trend make a pennant pattern.
The pennant pattern is further classified into two types
- Bullish pennant pattern
- Bearish pennant pattern
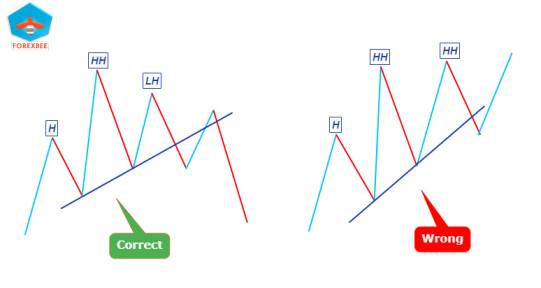
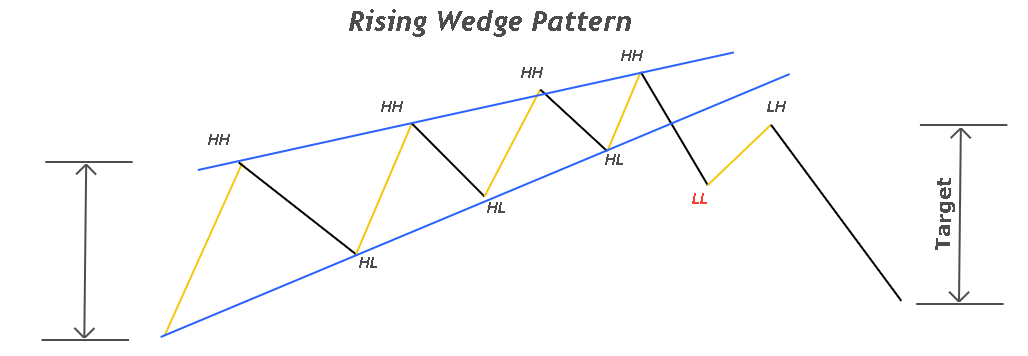
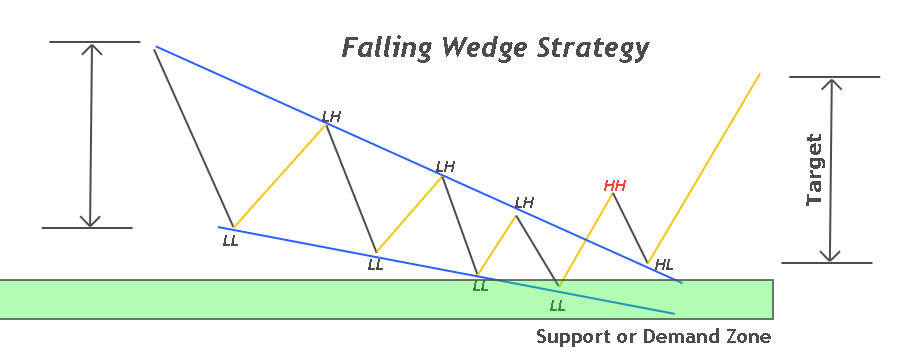
Wedge chart Pattern
The wedge pattern is a trend reversal chart pattern in which the price structure resembles a wedge shape. A Wedge has a wider outer section and smaller outer section. It is also a natural pattern because it depicts the natural behaviour of price.
It consists of two trend lines (upper and lower trendlines) and more than three waves inside the trend lines. The size of the waves continues decreasing with time, and after the trend line breakout, a trend reversal happens in the market.
Based on the price structure or higher high lower low formation, wedge pattern is classified into two types
- Falling wedge pattern
- Rising Wedge pattern
The rising wedge shows the bearish trend reversal, and the falling wedge pattern indicates a bullish trend reversal in the market.
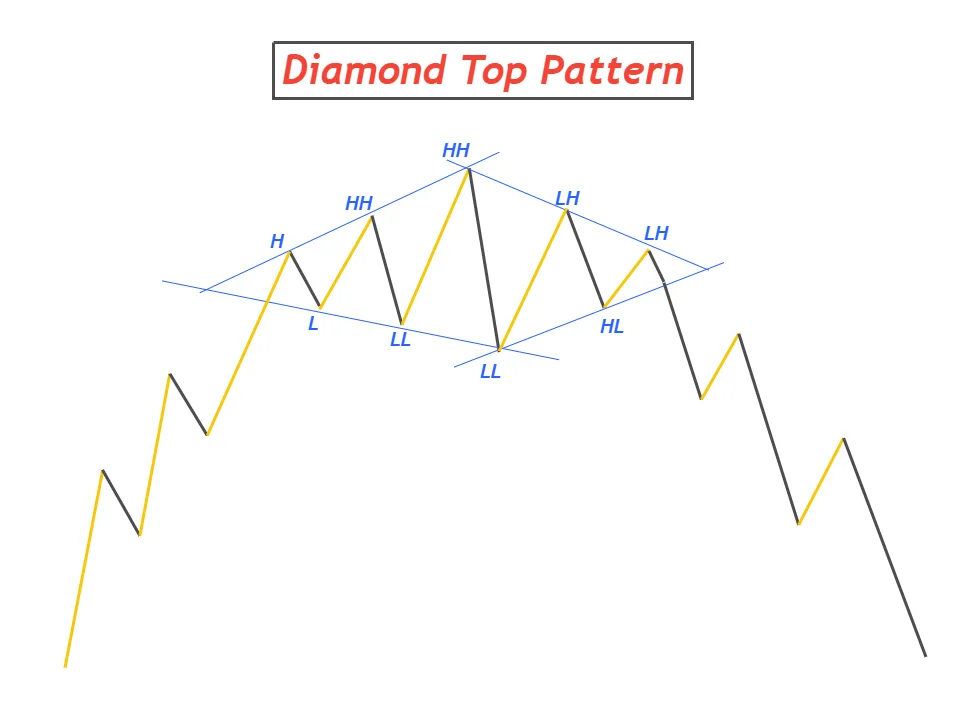
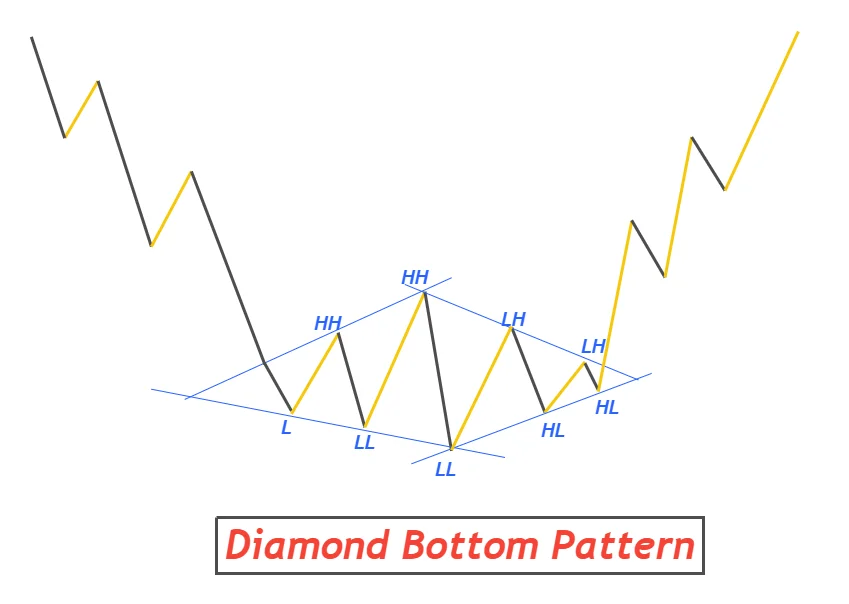
Diamond chart Pattern
A diamond pattern is a reversal and continuation chart pattern in which price forms a structure of diamond on the chart. Two market patterns (broadening and inward consolidation) combine to make a diamond pattern.
The location of the diamond chart pattern decides whether it will be a trend reversal pattern or a trend continuation pattern.
The basis on the location, it is classified into two types
- Bullish diamond chart pattern
- Bearish diamond chart pattern
If a diamond pattern forms at the top of the trend, a bearish trend reversal will occur. On the other hand, if it begins at the bottom of the bearish trend, then a bullish trend reversal will form.
It will act as a continuation chart pattern when it forms between the trend.
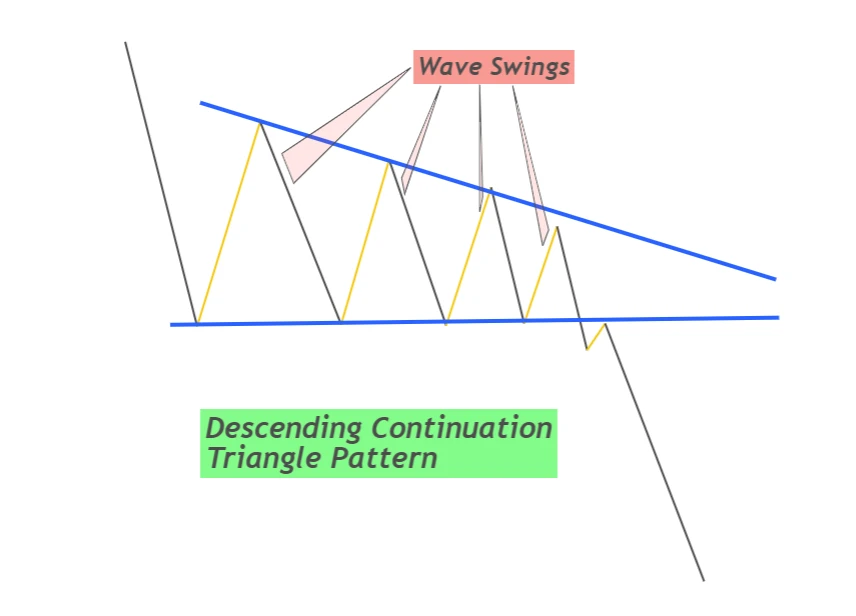
Descending triangle pattern
The descending triangle is a bearish continuation chart pattern in which price forms a triangle-like shape with a horizontal base and vertical line on the left side.
Look at the image below for a better understanding of the pattern.
In this pattern, price forms swing so that each progressive swing will be smaller than the previous wave. A support zone also forms at the bottom of swing waves.
A bearish trend continuation occurs on the chart when the support zone breaks.
It also acts as a reversal chart pattern, but it is mainly used as a trend continuation pattern.
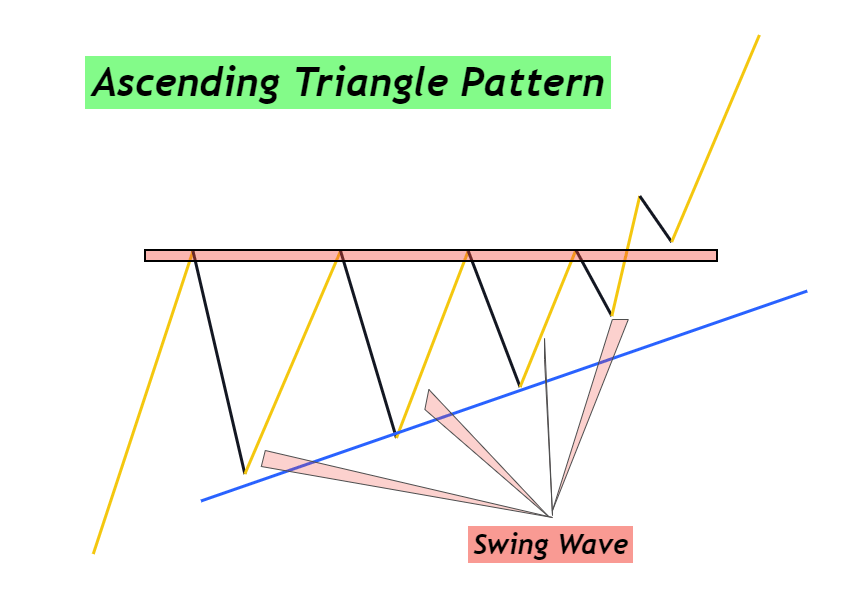
Ascending triangle pattern
The ascending triangle is a bullish continuation chart pattern in which the price forms a triangle-like shape with a horizontal base at the top.
Keep in mind that the base or support zone forms at the bottom of descending triangle, whereas in ascending triangle pattern, the base zone/resistance zone forms at the top of the chart.
It is the inverse of descending triangle pattern. Swing waves forms, and after a resistance breakout bullish trend continues. It is straightforward to identify these two patterns, and the probability of winning these two patterns is also very high.
Tip: GBPJPY is a pair that usually make ascending and descending triangle pattern on the price chart on different timeframes.
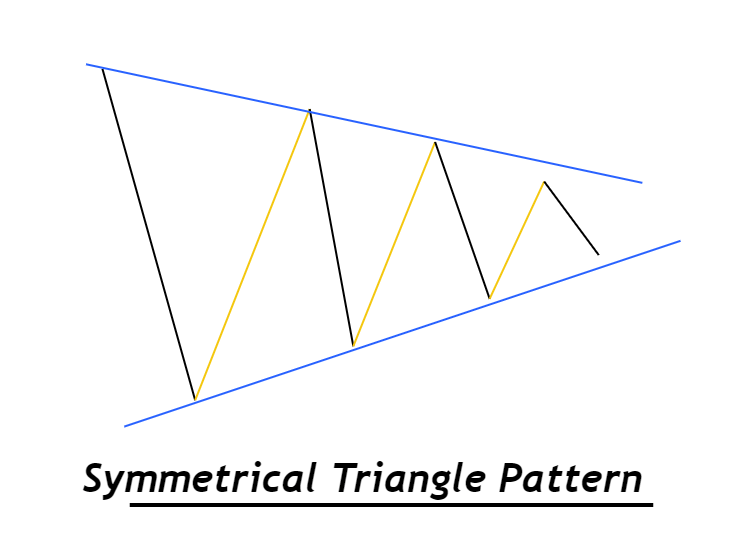
Symmetrical triangle chart pattern
The symmetrical triangle pattern acts as a reversal and continuation chart pattern because of its equal probability of a bullish or bearish trend.
This pattern shows that market makers are making decisions. So, the price moves sideways and inwards. Inward consolidation means each progressive wave will be smaller than the previous wave.
So how can we identify the trend direction using a symmetrical triangle pattern? Using the breakout method.
When this pattern forms, we draw the trendlines meeting the lower highs and higher lows. The breakout of trendlines shows that buyers will take control or sellers will overcome the market.
If the upper trendline breaks, buyers will take control of the market.
A break of the lower trendline means sellers will take control of the market.
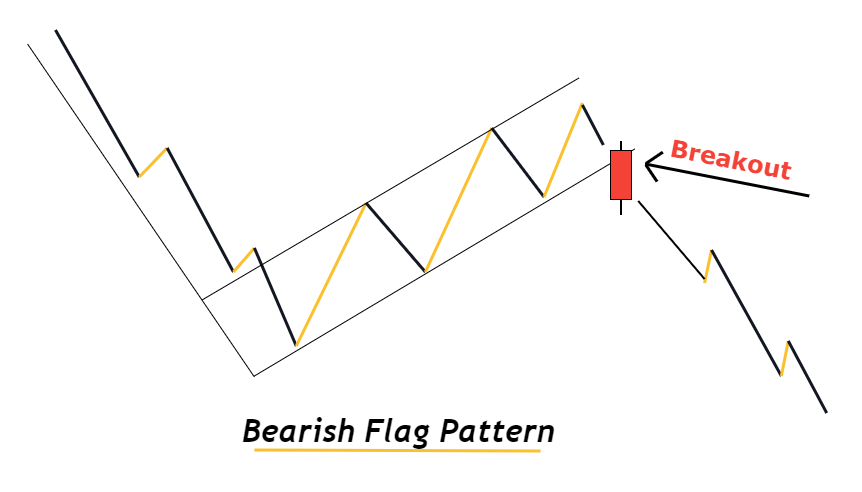
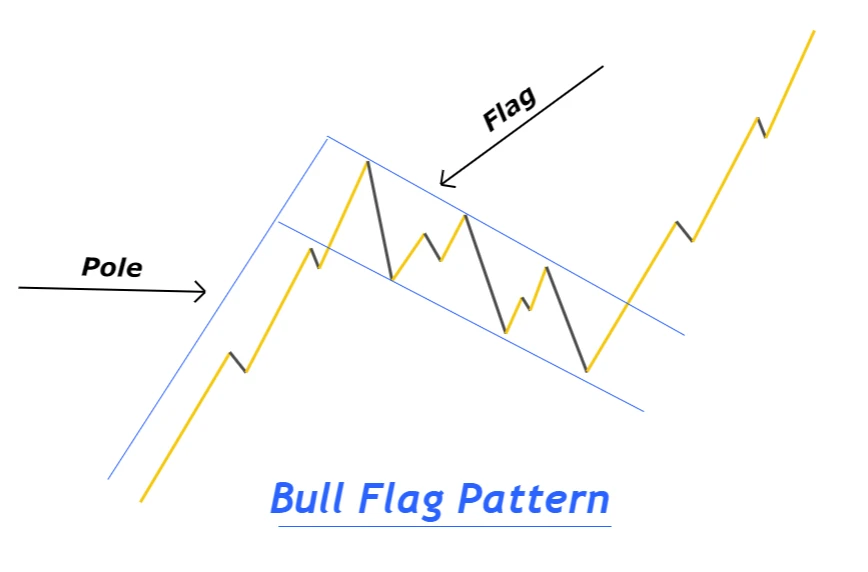
Flag chart pattern
A flag pattern is a trend continuation chart pattern consisting of an impulsive wave and a retracement wave.
The flag chart pattern is the most widely used and advanced. Because the psychology of this chart pattern is very deep, it can be used in many ways to predict the forex market direction.
Based on wave structure, flag pattern is classified into two types
- Bullish flag pattern
- Bearish flag pattern
An impulsive bullish wave and a bearish retracement wave combine to make a flag pattern in the bullish flag. The impulsive wave resembles the shape of a pole, and retracement resembles the shape of the flag on the pole. The breakout of the flag indicates the continuation of the bullish trend.
A bearish impulsive wave and a bullish retracement wave combine to make a flag pattern in the bearish flag.
This pattern usually forms in assets, currencies, or commodities.
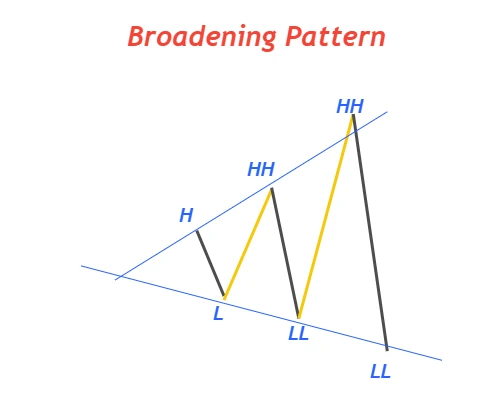
Broadening Pattern / Megaphone pattern
A broadening pattern is a chart pattern in which each successive wave is bigger than the previous wave making a megaphone-like structure on the price chart.
This pattern also shows indecision in the market, and it is also a symbol of a big trend reversal.
Based on the structure and location, the megaphone chart pattern is classified into three types
- Megaphone pattern
- Ascending broadening pattern
- Descending broadening pattern
In the ascending broadening pattern, the price makes lower lows and lower highs, while in descending broadening pattern, the price forms higher highs and higher lows.
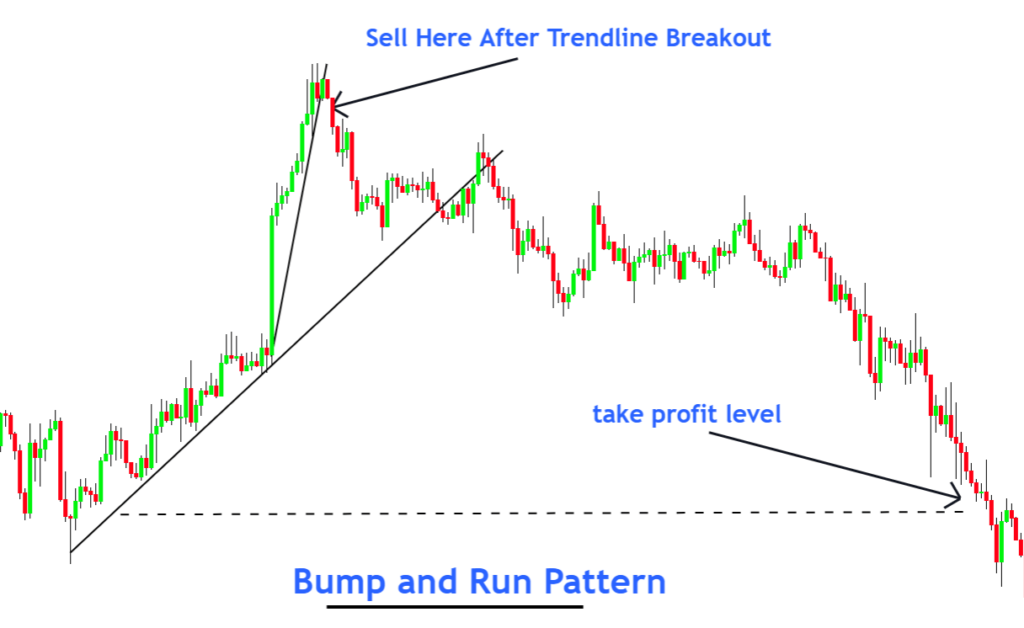
Bump and Run chart pattern
The Bump and the Run pattern is a chart pattern that consists of two phases of the market the Bump and the Run.
In the Bump phase, the price shoots up/down with ultra-force representing a break of a major key level. After the Bump phase, the run phase starts, and, in this phase, the price moves in the opposite direction to the bump phase.
This is also a strategy used by market makers to deceive retail traders.
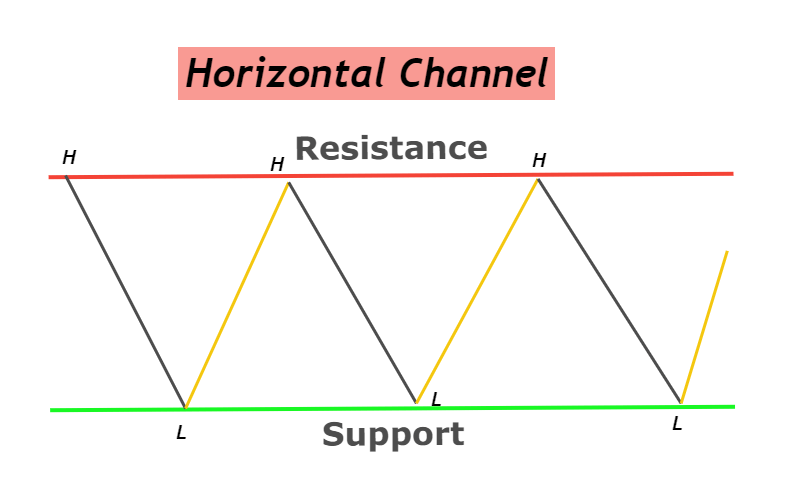
Horizontal trend channels
Trend channels refer to price channels indicating the sideways price movement between a resistance zone and a support zone.
This price pattern shows the equal forces of buyers and sellers in the market. Due to this, the price moves sideways. The breakout of trend channels predicts the direction of the price trend. A bearish trend occurs if the support zone breaks, while a bullish trend forms if the resistance zone breaks.
In the horizontal trend channel, price moves in the form of swings making highs and lows. It is also called the ranging market.
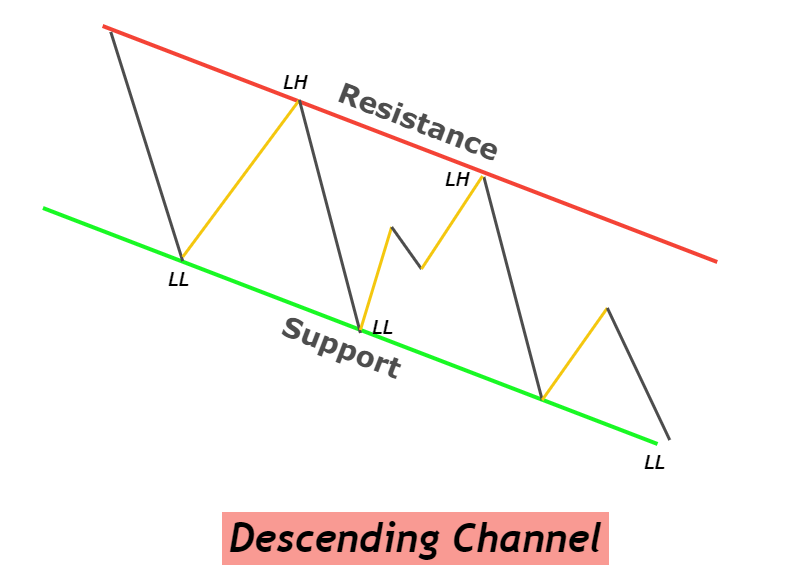
Descending channel pattern
Descending channel is a bullish trend reversal pattern in which price moves within a descending channel, and after an upper trend line breakout, a bullish trend starts.
In this type of channel pattern, the price makes lower lows and lower highs. The upper trendline meets the lower highs of price swings, and the lower trendline meets the lower lows of price waves.
It is a bullish trend reversal chart pattern.
It would be best not to confuse the descending wedge pattern with the descending channel pattern because the trendlines in the descending channel are parallel.
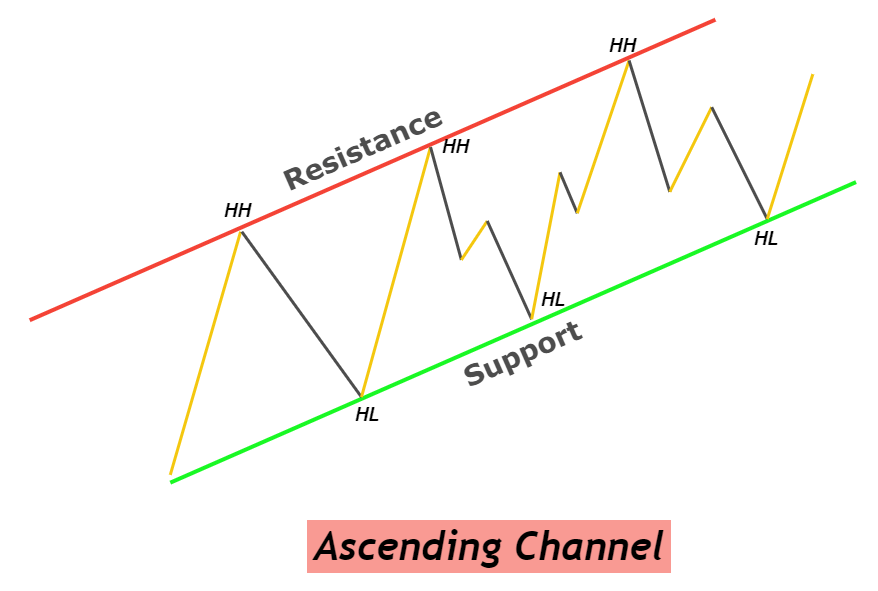
Ascending channel pattern
Ascending channel is a bearish trend reversal pattern in which price makes higher highs and higher lows, and it moves within a channel of parallel trendlines.
The upper trendline meets the higher highs, and the lower trendline meets the higher lows. The Upper trendline acts as a resistance line, and the lower trendline acts as a support line.
A bearish trend starts when a breakout of a lower trendline happens with a big bearish candlestick. This pattern turns the bullish price trend into a bearish trend.
Download PDF
Click on the button to download the PDF file of images of all candlestick patterns for backtesting purposes only
Conclusion
Retail traders widely use chart patterns to forecast the market. The patterns that repeat with the time on the chart of different currencies are chart patterns.
I will highly recommend you always use chart patterns in trading. You can use candlestick patterns and other technical tools with these patterns to increase the winning probability in trading.
Thank you for knowledge
so good …. If possible, you can add these patterns from chart.
Thanks for help
This is the best website to learn patterns. Thank you for this.
I want to get all chart patterns recently
I what to get A chat
I’m extremely happy to have come across this useful information. My trading knowledge is growing bigger.
Good chart pattern
thank you
good for every trader