
Definition
The ascending triangle pattern is a reversal or continuation price chart pattern that resembles the shape of a triangle with a base on the upper side. It is a price Pattern that forecasts the future price of an asset or currency pair.
- This chart pattern will acts as a continuation chart pattern if it forms in the mid of the trend
- Ascending triangle Will act as a reversal chart pattern if it forms at the top or bottom of the price chart.
This is the simplest chart pattern that mostly forms on the price chart in forex trading.
How to identify ascending triangle Patterns?
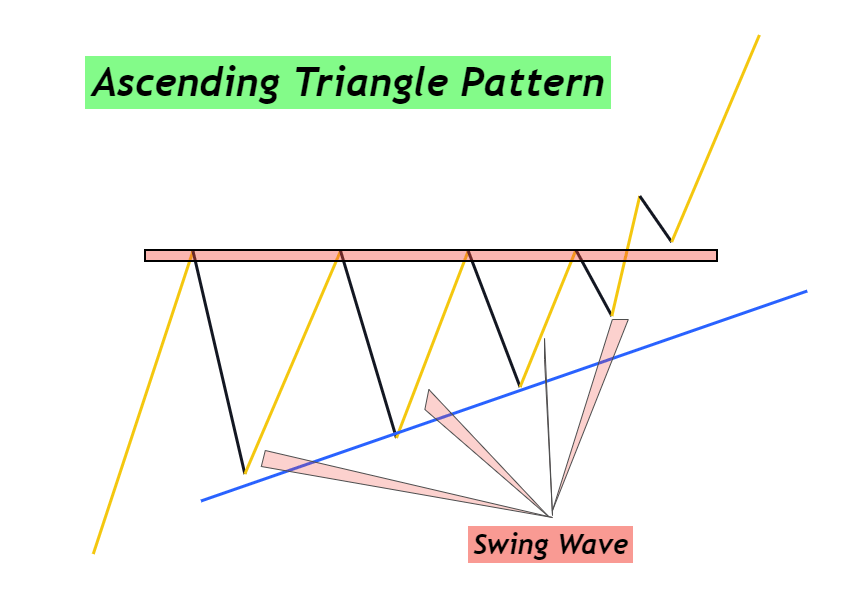
Unlike descending triangle pattern, the base of the triangle will form on the upper side. Price will bounce at least three times from the same base level in the form of small waves. Each progressive wave will be smaller than the previous wave.
Draw a zone connecting the highs of each wave and it will act as a base for the triangle pattern. Now connect the higher lows of this chart pattern with a trendline resulting in the formation of the hypotenuse of the triangle.
Hypotenuse and base of triangle price pattern will act as support and resistance respectively.
Remember these rules to identify a perfect trading pattern.
- Higher low of each progressive wave Should be greater than previous wave. It will form a shape of rising trendline.
- The swing waves should form in a clear format. Avoid choppy makret environment.
- At least three swing waves should form in triangle pattern. A price Pattern will not be considered an ascending triangle if it has less than three swing waves.
Working method of ascending triangle pattern
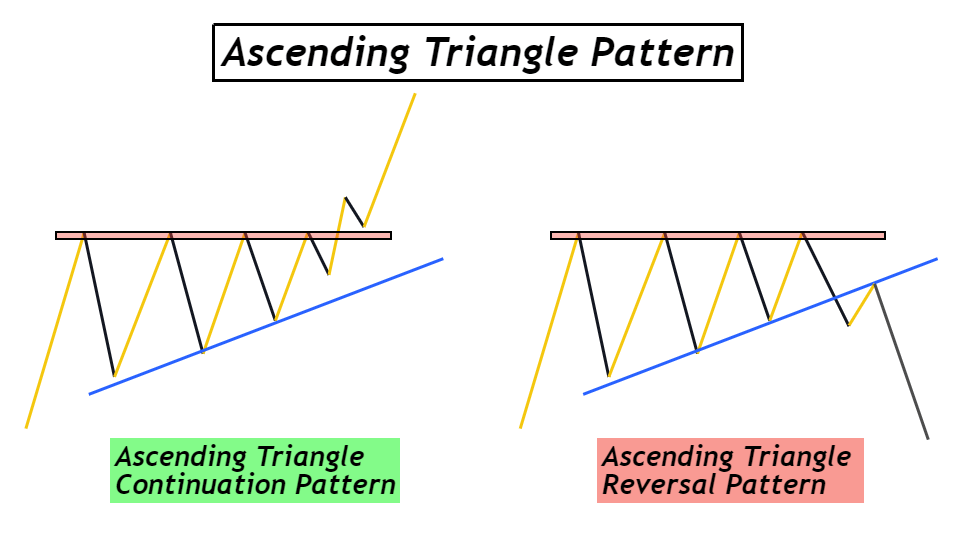
Ascending triangle pattern is neither bullish nor a bearish chart pattern. The breakout of trendline or base decides either price will go up or down. That’s why it will act as both reversal or continuation chart pattern. Only location and breakout decide the nature of the chart pattern.
Reversal pattern
If this price pattern forms at the top of the price chart or at some strong resistance level, then after the Breakout of the trendline in a downward direction this pattern will act as a reversal chart pattern.
This will happen mostly when the price is not capable of breaking the resistance zone and then due to more pressure from sellers, the price breaks the trendline and reverses from the resistance zone.
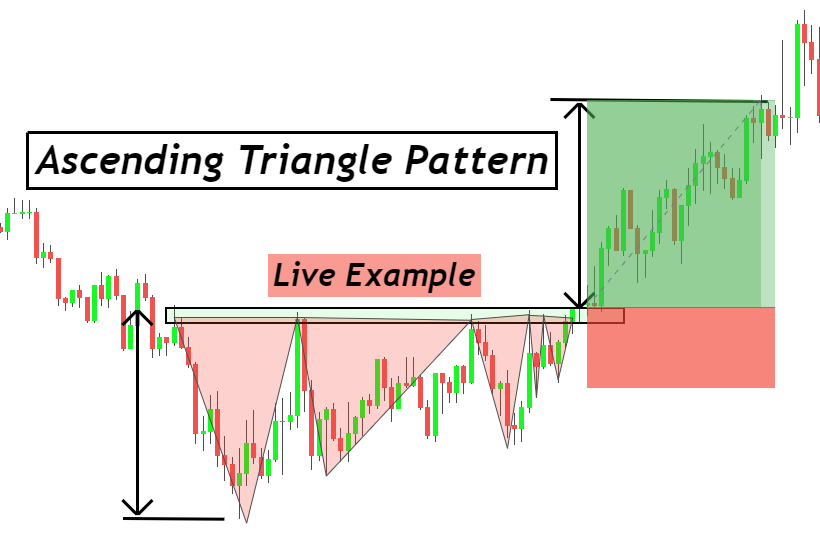
Look at the image below for a better understanding of this price pattern
Continuation pattern
If price breaks the base or resistance zone of ascending triangle pattern due to the large momentum of buyers, then this price pattern will act as a continuation chart pattern in trading.
This pattern has a high probability of winning because of trading with the trend. Usually, this pattern forms in the mid of the trend.
Pro Tip: You should not trade an ascending triangle pattern in a bullish direction if the price is already in an overbought condition. Because it can be a false breakout of the resistance zone.
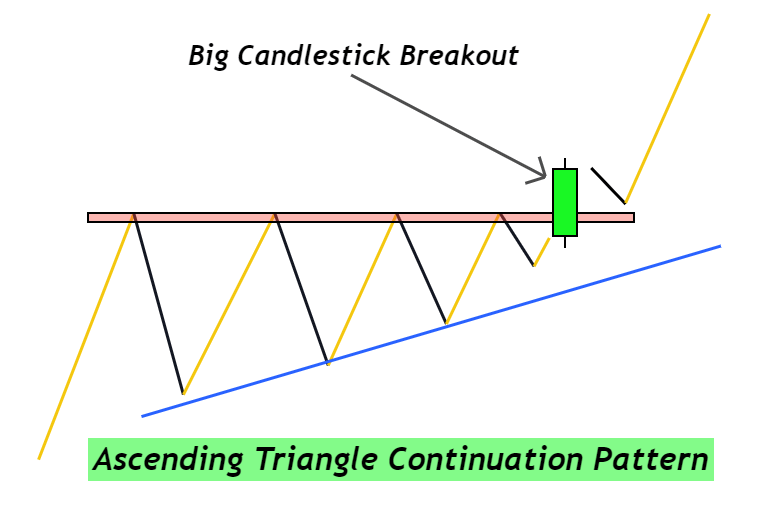
Breakout of ascending triangle pattern
Market makers try their best to capture the retail traders by generating many false signals. To avoid false signals, a retail trader should add confluences to the trading setup or backtest the system properly and filter out the good setups only from the crowd.
To identify a false breakout, one of the proven methods is to analyze the candlestick that is breaking the trendline or resistance zone. The candlestick that is breaching through the zone must be bigger in size than a few previous candlesticks. Bigger size indicates large momentum. Breakout must be with a large momentum instead of small momentum that does not make sense.
Best working conditions for ascending triangle chart pattern
There are two best working conditions you should add to your trading strategy to get better results.
- For reversal trading setup, ascending triangle pattern should form in the overbought conditions. Overbought conditions can be checked using RSI indicator or price action.
- For continuation trading setup, ascending triangle pattern should form in the mid of the trend. Or you can confirm using RSI indicator with value close to 50.

Trading plan
This chart pattern is quite easy to spot on the price chart. That’s why before planning a trade, you should filter trade setup using the conditions discussed in the above section.
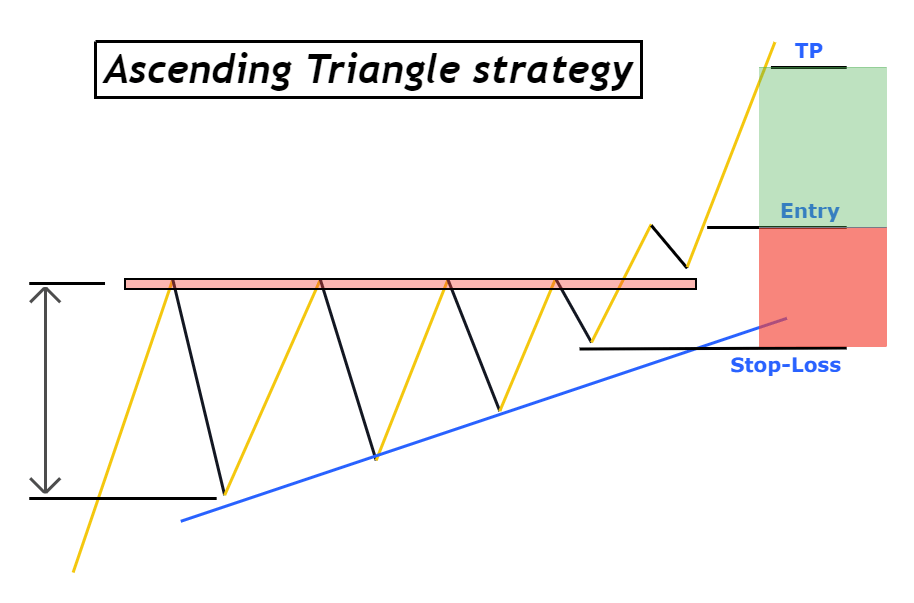
When to open a trade
Place a buy trade instantly just after the breakout of base or resistance zone of ascending triangle pattern.
Pro tip: Do not open a trade if the risk-reward is less than 1:1 after the breakout. If this happens then wait for the price to give a minor pullback and then open a buy trade to get a high RR ratio.
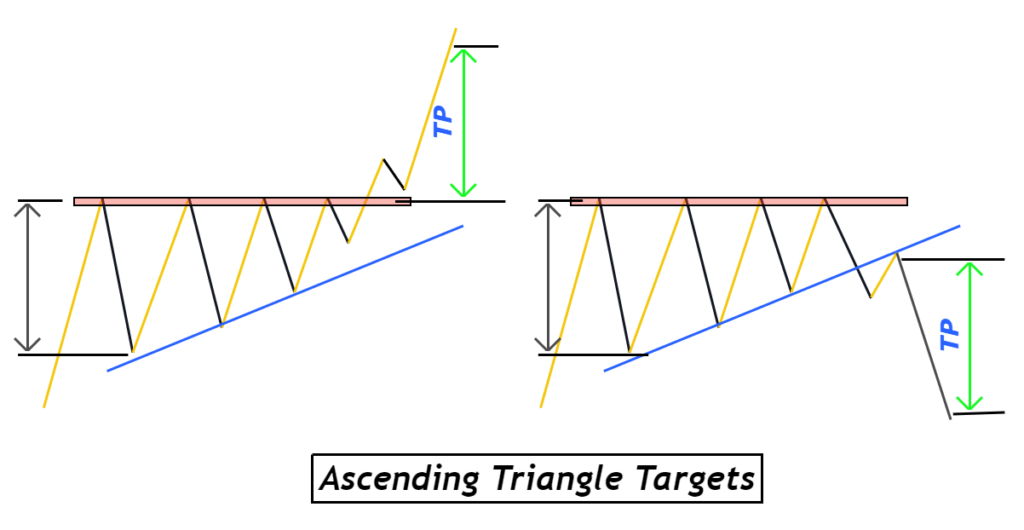
Measure target level in ascending triangle pattern
Target level is measured by calculating the distance in pips between the resistance zone and the Low of the biggest price wave. For example, if the distance is 100 pips on a daily timeframe then the take profit level will be 100 pips away from the zone.
Stop-loss level
Place stop-loss below the low of the last swing wave of ascending triangle pattern after the Breakout of the zone.
If you are not able to identify this wave correctly then you can place stop-loss below the low of the second last wave. It will become a safe stop-loss level.
Minimum risk reward ratio
The minimum risk-reward ratio for this ascending triangle chart pattern is 1:1. The minimum risk you should take is less than 2% per trade.
Conclusion
Ascending triangle patterns mostly form in the currency pairs with JPY as a quote currency. It is a natural chart pattern and it works correctly. You need to add filters to avoid false trading setups.
When you will backtest this system at least 100 times then you will know the difference between a true and false setup.
It is recommended to properly backtest this strategy before trading on a live account.
FAQs
The daily timeframe is the best timeframe for this chart pattern but it will also work in lower timeframes for forex trading only.
Yes, it works in stocks. But you should trade this pattern on higher timeframes for stocks like daily and weekly timeframes.