

Definition
The Three Stars in the south is a bullish reversal candlestick pattern made up of three bearish candlesticks. In this candlestick pattern, each candlestick forms within the range of the previous candlestick.
This candlestick pattern has a very low probability of occurrence on the candlestick chart. But still, it can be used in trading for many purposes like trend analysis. The structure of this pattern also relates to the inside bar candlestick pattern, but there is a complete difference in the psychology of both patterns.
How to identify the three stars in the south pattern?
You need to follow a complete criterion to find this candlestick pattern on the price chart. It forms after forming three bearish candlesticks in a specific sequence and shape.
Here are a few guidelines
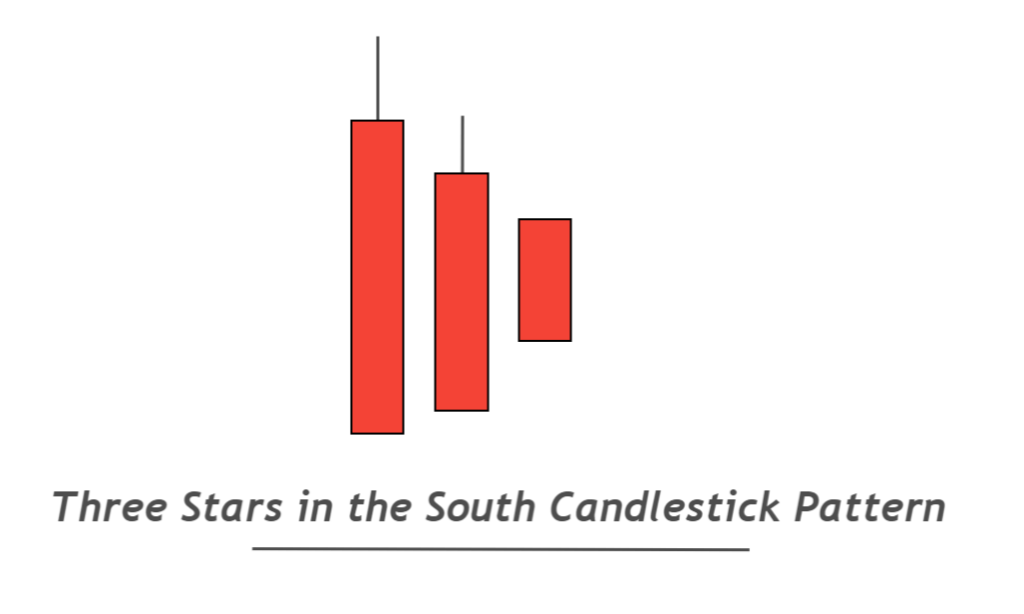
- The first candlestick is a large candlestick representing a significant price decrease. A large wick on the upper side of the first candl3 also forms usually.
- The second candlestick is also a red/bearish candlestick, and it forms within the range of the first big candlestick. It will make a higher low and lower high like an inside bar candlestick. This candlestick will also have a small wick on the upper or lower side.
- The third candlestick will be a small bearish marubozu candlestick. It will also form within the range of the previous candlestick making a new high low and lower high.
These are a few simple rules you need to follow to identify the three stars in the south candlestick pattern.

Find High Probability Trades with this ADVANCED Candlestick Patterns Course
The Ultimate Candlestick Patterns Course That Will Help You To Trade Better
Best working conditions for the three stars in the south pattern
I have filtered three confluences that will increase the probability of winning in this trade setup.
- Support zone: When the three stars in the south pattern form at the support level, there are many chances of a bullish trend reversal.
- Demand zone: At the demand zone, Buyers wait for the price to come to the demand zone to let the price fill their buy orders.
- Oversold condition: The formation of a three-star in the south pattern during oversold conditions will have a high probability of winning. Oversold conditions can be checked using the RSI indicator.
Three stars in south: Information Table
| Features | Explanation |
|---|---|
| Number of Candlesticks | 3 |
| Prediction | Bullish trend reversal |
| Prior Trend | Bearish trend |
| Relevant Pattern | Inside bar |
The psychology behind the three stars in the south pattern
The psychology behind every candlestick pattern tells us the activity of traders behind the chart so we can forecast the price by analyzing their actions.
In the case of three stars in the south candlestick pattern, the first big bearish candlestick represents that sellers are in control and a price of an asset or currency has been decreased. Now the price is in an oversold condition.
The next candlestick form within the range of the previous candlestick shows that sellers are unable to make a new lower low. They fail to continue the downtrend. Buyers have tried their best, but still, they are unable to create a new higher high. So there is a trend pause in the market.
The third candlestick with a small body size indicates that the forces of buyers and sellers are equal. Sellers have lost the previous momentum, and buyers have gained momentum. Small price movements in the market also indicate the upcoming storm in the market.
After completing the pattern, a significant bullish candlestick will form, breaking the highs of the previous three candlesticks, and a new bullish trend will start.
Why should you not trade the three stars in the south pattern?
A few limitations recommend not using this candle pattern for trading purposes. However, you use it for the analysis of a currency or stock.
There are limitations
- Low winning rate
- Negligible occurrence rate
- Very difficult to project take profit levels
The Bottom line
It is always advised to choose a few patterns and then master them only to get profitable results. Besides these patterns, other patterns can be used for analysis purposes.
For example, you found three stars in the south candlestick pattern on the daily timeframe. You came to know that market will reverse, and the bullish trend is about to start. You will have to switch to the lower timeframe and only apply your strategy in a bullish direction.
This is the way to trade such candlestick patterns.