
Definition
Wolfe wave indicator is a technical indicator made using the pine script programming language, and it identifies the wave patterns on the price chart.
This indicator is available on tradingview, so you can also use this indicator on a mobile device.
Before proceeding further, read this post related to the Wolfe wave to increase your knowledge about this wave pattern.
How does Wolfe wave indicator work in trading?
This indicator uses the relationship between the waves. It is mainly a script that helps identify the trading setups quickly on the price chart.
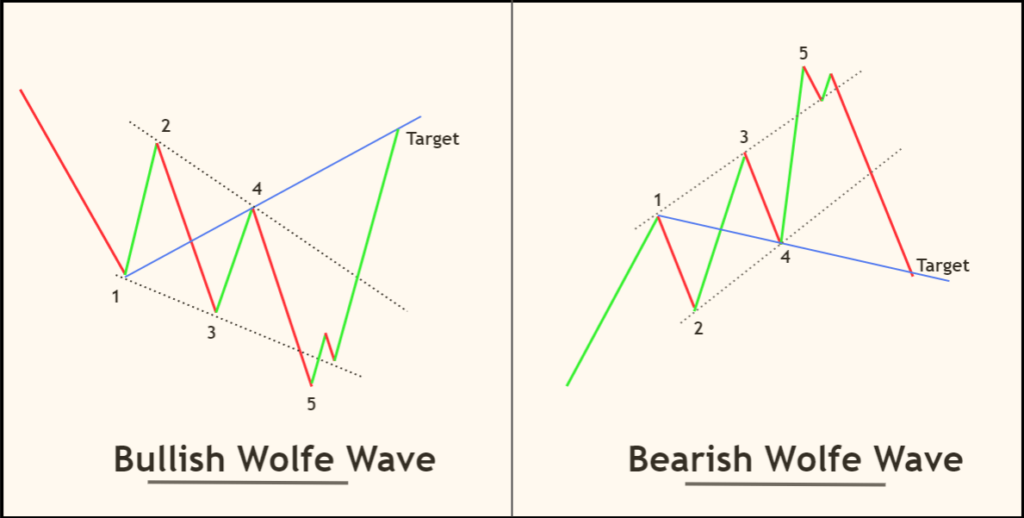
The author of this indicator has used a Fibonacci sequence between the waves to determine the chart pattern. According to details, the relationship between wave 3 to 4 and wave 2 to 3 is the Fibonacci ratio of 127%. There is a 68% Fibonacci ratio sequence between waves 3 to 4 and waves 1 to 2.
As in the Wolfe wave pattern, the wave 3-4 is always shorter than the wave 1-2. That’s the primary requirement for this pattern, so the author used the Fibonacci ratios.
How does the Wolfe wave indicator generate buy/sell signals?
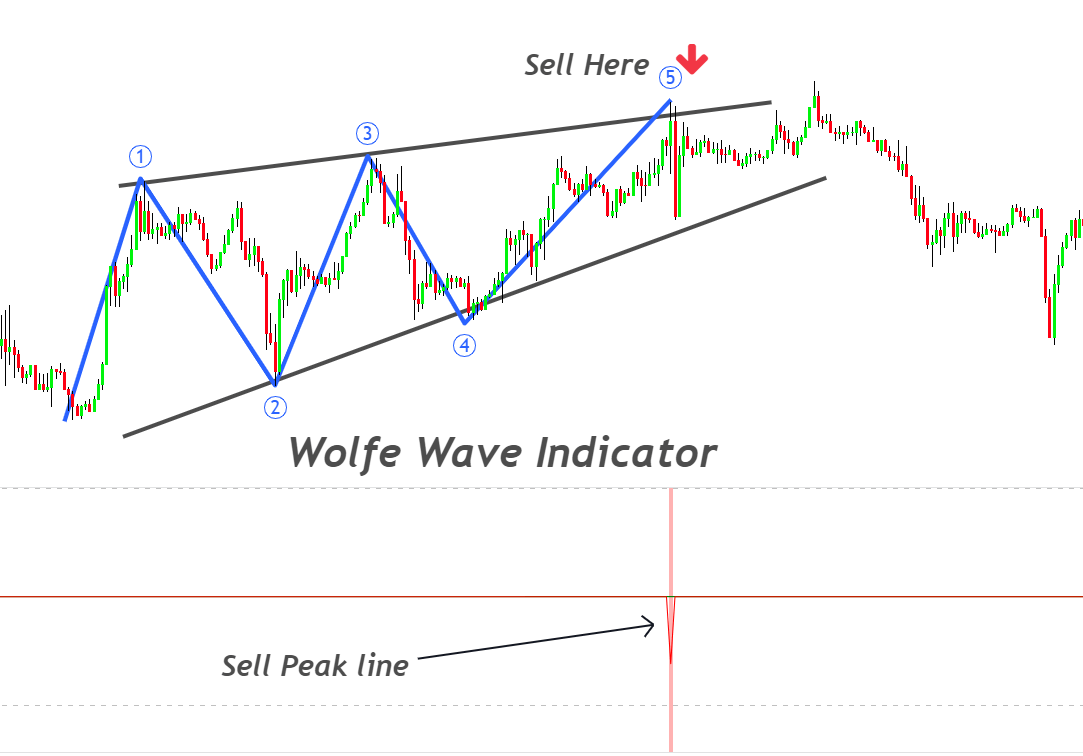
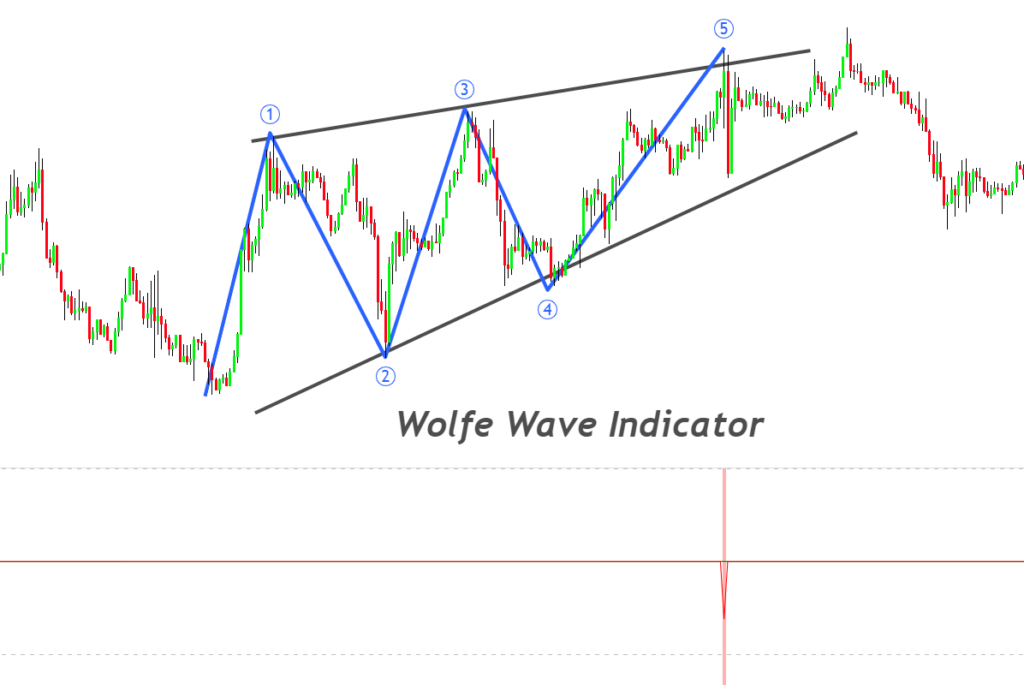
Signals are generated in the form of a line peak. The peak forms whenever a Wolfe wave pattern form on the chart.
The major drawback of this indicator is that it does not plot Realtime wave lines on the candlestick chart. It will only signal the formation of a pattern in a separate window in the form of a line peak.
The benefit of this indicator is that you will not have to sit in front of the screen to find the wave pattern. Instead, whenever this indicator alerts a signal, you can verify by looking at the chart and placing an order appropriately.
Buy signal
When a green line peak forms, a bullish trend reversal is about to happen (Bullish Wolfe wave pattern). The height of the green line is directly proportional to the strength of the signal.
Sell signal
When a red line peak forms, a bearish Wolfe wave pattern has been formed on the chart. It is an indication of a bearish trend reversal. The height of the red line is directly proportional to the validity of the signal.

How to trade with the Wolfe wave indicator?
you should not entirely rely on the indicator. Because to increase the winning ratio of the Wolfe wave trading strategy, you should manually review each signal.
For example, if the indicator generates a sell signal, you should not instantly open a sell trade. Before executing a trade, you should manually check the chart using wave analysis and then decide to skip or trade it.
Following the above method will increase the winning ratio of the Wolfe wave strategy. Because the first indicator helps to identify all the possible trade setups, we will manually refine good trade setups.
The bottom line
It is not easy to do wave analysis on high volatile markets like forex trading. The indicator helps to identify these setups correctly and saves a lot of screen time. It will also improve psychology to much extent.
Make sure to backtest this indicator properly on the demo account for good results.