
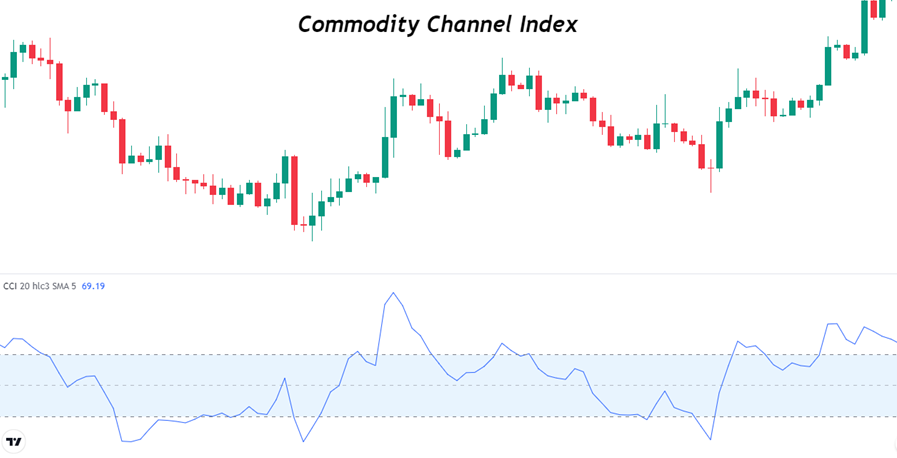
The CCI (Commodity channel index) indicator measures the current price level to an average price over a given period.
Developed by Donald Lambert, the CCI is a momentum oscillator that you can use to identify trend continuation and reversal. It oscillates below and above the zero level.
The majority of CCI movement occurs between -100 and +100. If the CCI signal line goes above or below this level, it indicates overbought and oversold levels.
Formula
The formula for the CCI indicator is
CCI = (Typical Price – MA) / (.015 x Mean Deviation)
Where:
Typical Price (TP) = (High + Low + Close)/3
MA = Moving Average
Constant = .015
Calculations
To calculate the CCI, you need to follow certain steps.
- Firstly, you need to determine the period. 20 is the most common period, but you can set it according to your trading strategies.
- Make a spreadsheet to find the typical price and find the high, low, and close of the 20 periods.
- Add the last 20 typical prices to locate the MA and divide it by 20.
- The mean division value involves subtracting the MA from the typical price of the last 20 periods. Then, add the absolute values of these numbers and then divide by 20.
- After finding all the values, add them to the formula mentioned above.
Here’s one thing you need to remember. Lambert set the constant at .015 so that 70 to 80% of CCI values range between -100 and +100. However, it depends on the period too.
A shorter period will be prone to volatility and would range between -100 and +100 in a small percentage. On the flip side, if you are using a longer period, there is a high chance of values falling between -100 and +100.
Best settings for the CCI indicator
The best settings for the indicator are:
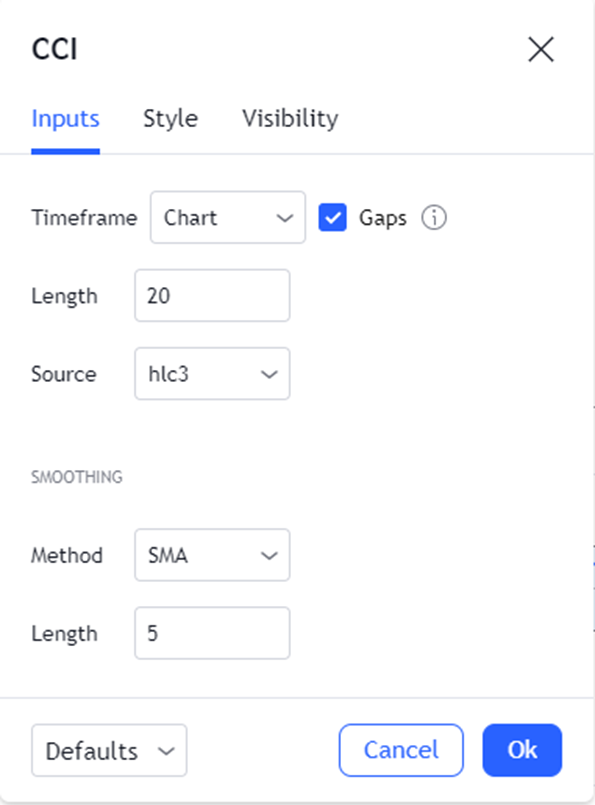
The length, by default, is set at 20. You can set the higher period. As mentioned above, a higher period gives a better probability of values falling between -100 and +100.
The MA method is SMA, but you can change it to your preference.
The timeframe should be higher, as CCI is prone to false signals on the lower timeframes.
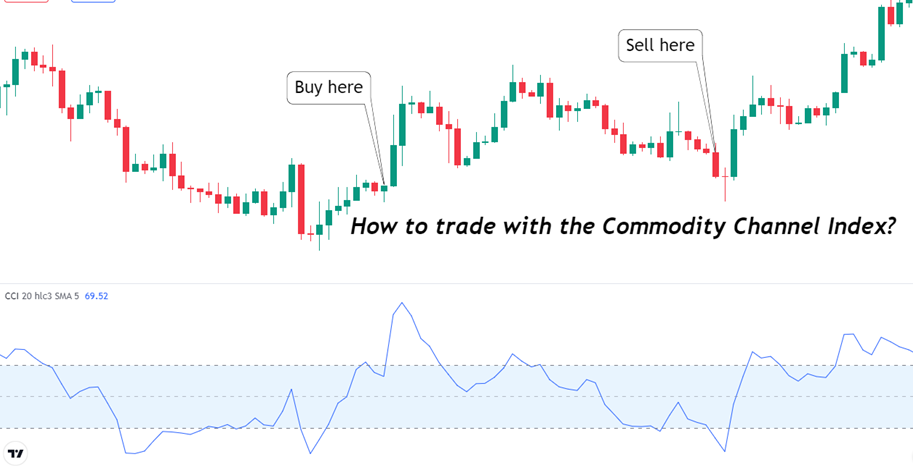
How to trade with the CCI indicator?
You can trade with the indicator using multiple ways; locating trend direction, finding overbought and oversold levels, and identifying divergences.
When the CCI moves above +100, it signals a potential uptrend. When this happens, you can take long positions or exit short ones.
On the flip side, if the CCI moves below -100, it starts a downtrend. Here, you can enter short or exit long positions.
You can look for overbought levels when the indicator goes above +100 and oversold levels when the CCI goes below -100.
You have to remember that CCI is an unbound indicator, which means it has no upsides or downsides. So, you have to add another indicator to confirm overbought/oversold levels.
You can also find divergences with the CCI. If the price makes a new high/low and the CCI moves oppositely, it suggests a trend reversal.
While divergence may not be a good trading signal with the CCI since it may continue for a long time and does not necessarily result in a price reversal, it can be useful for you to know about the upcoming reversal.
So, you can leave the trade or may tighten your stop-losses.
Advantages of the CCI indicator
- The indicator tells about the trend continuation and reversal.
- Interpreting the indicator is relatively easy.
CCI vs Stochastics indicator
CCI and stochastics are momentum oscillators, and both tell overbought/oversold levels.
However, Stochastics oscillates between 0 and 100, while the CCI is unbounded.
Also, CCI and Stochastics may identify overbought and oversold levels differently because of their calculations.
Summary
The commodity channel index is an oscillator that identifies overbought/oversold levels to tell the direction of the trend.
-100 and +100 are the important levels you have to look for when trading with the indicator. A CCI value above +100 indicates an overbought level, while a reading less than -100 indicates an oversold level.
Many traders use the CCI along with other indicators for further signal confirmation.